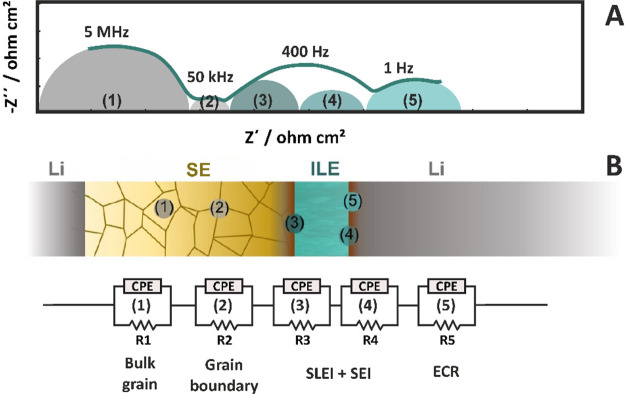
Figure 28.
(A) Nyquist plot of Li|ILE|SE|Li (green line) cell with its respective fit and characteristic peak frequencies. (B) Schematic of the Li|ILE|SE|Li cell and the equivalent circuit used for fitting the impedance data. Li, Lithium electrode, SE, solid electrolyte, ILE, ionic liquid electrolyte, ECR, electrochemical reaction. Adapted with permission from ref (85). Copyright 2021 Wiley.

