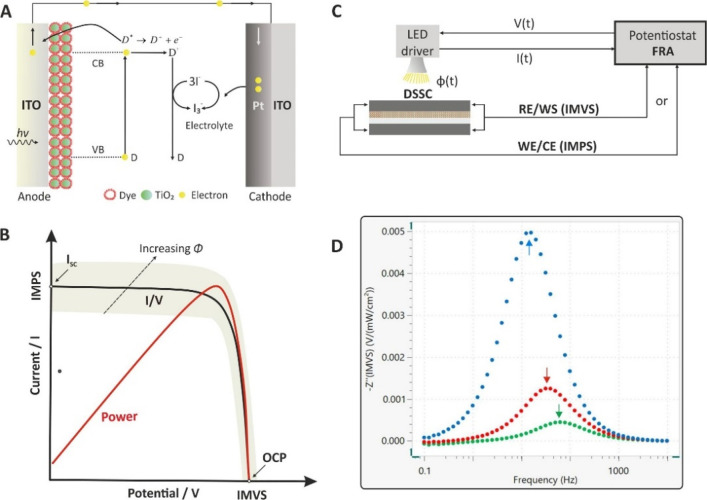
Figure 30.
(A) Schematic representation of a DSSC and (B) current–voltage plot of a DSSC. The gray area denotes the voltage perturbation around OCP and the current perturbation around Isc defining the examined IMVS and IMPS areas under modulated light intensity (C) A simplified experimental setup for the generation of modulated light intensities and cables connection at IMPS and IMVS measurements (D) Imaginary component −Z″(IMVS) of the IMVS transfer function versus the frequency range from 10 kHz to 100 mHz at three light intensities 5 (blue dots), 10 (red dots), and 50 mW/cm2 (green dots) with a DSSC, using the N719 dye. Courtesy of Metrohm Autolab B.V.109

