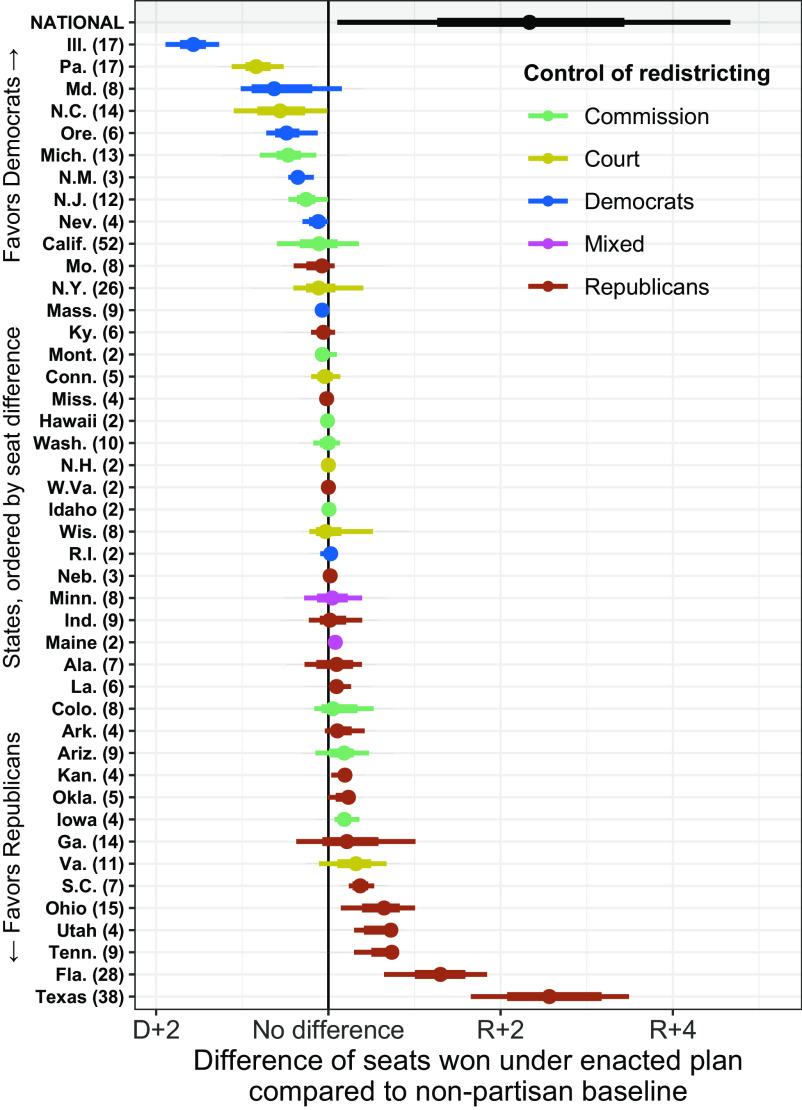
Fig. 1.
Estimated state and national level partisan bias. Estimates show the expected Republican seats under each nonpartisan baseline plan subtracted from the expected Republican seats under the enacted plan. Bars to the right indicate that the enacted plan gives more seats to Republicans, while to the left indicates more seats for Democrats. The vertical black line indicates no partisan bias. The thick and thin bars show 66% and 95% intervals of the simulated plans, respectively, after averaging over uncertainty in future electoral swings at the national and district level. The point indicates the median. States are colored by the actors who controlled the map drawing in each enacted plan, and are ordered vertically from the largest Democratic-favoring state to the largest Republican-favoring state. The number of seats in each state is shown in parentheses. In SI Appendix, section E, we rescale the effects as a share of the state’s seats and as z-scores.

