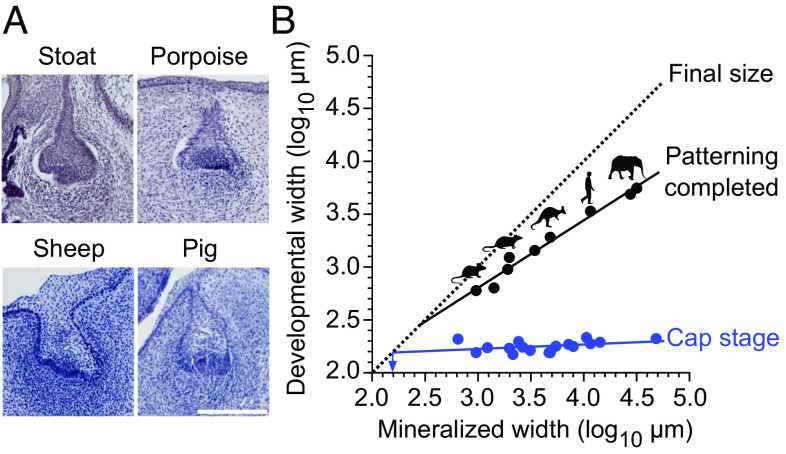
Fig. 7.
Patterning scales across mammals. (A) Frontal sections of developing teeth of various mammals show similar buccolingual widths of tooth germs at early cap stage. The sections show dp4 (sheep), p4 (stoat), and dp3 (pig). The porpoise tooth identity cannot be determined. (B) The cap-stage tooth widths (blue) do not show a marked increase with the final mineralized tooth widths (regression slope is 0.043 and the intercept is 2.095, r2 = 0.163), and the regression-line extrapolated minimum tooth width is 154 µm for single-cusped teeth (arrow). In contrast, the widths when the patterning is completed increase as the teeth become larger (black line, regression slope is 0.640 and the intercept is 0.885, r2 = 0.976). The point when tooth development reaches the final tooth size is marked with the dashed diagonal (X and Y axis values are the same). For sample and regression details, see SI Appendix, Tables S9 and S10. (Scale bar, 200 μm in A.)

