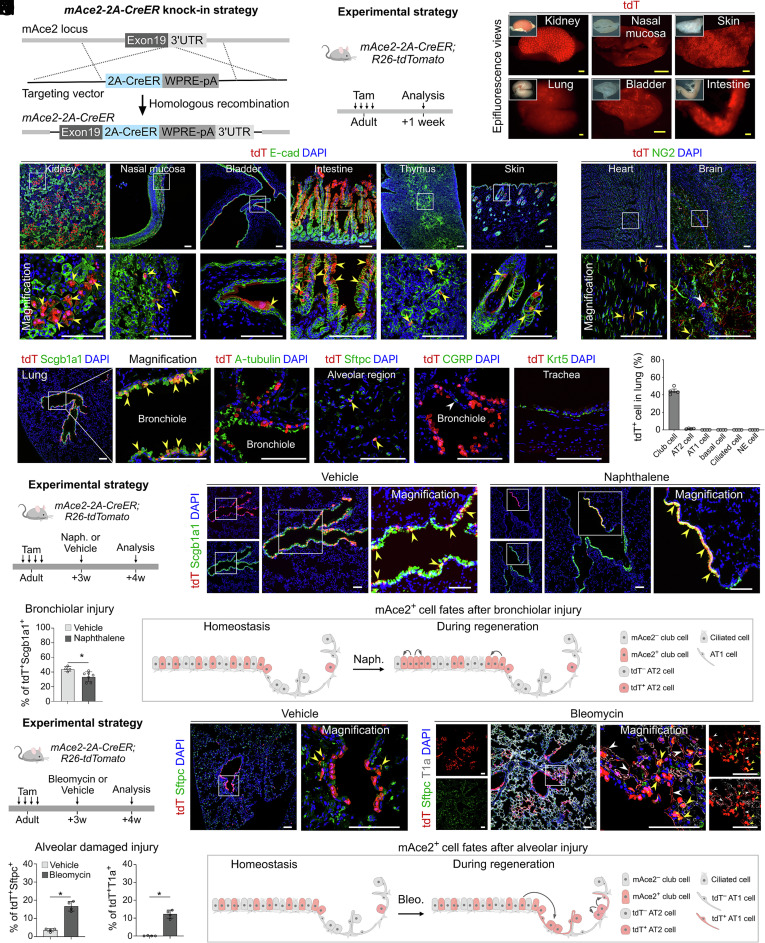
Fig. 1.
Generation and characterization of an mAce2-2A-CreER line. (A and B) Schematic diagrams illustrating the knock-in strategy of mAce2-2A-CreER by homologous recombination using CRISPR/Cas9 (A) and the experimental design (B). (C) Whole-mount fluorescent images of organs from mAce2-2A-CreER;R26-tdTomato mice after tamoxifen induction. (D and E) Immunostaining for tdTomato and E-cad (D) or NG2 (E) on tissue sections of mAce2-2A-CreER;R26-tdTomato mice after tamoxifen treatment. Yellow arrowheads, tdT+E-cad+ cells (D), tdT+NG2+ cells (E); white arrowheads, tdT+ neural cells. (F) Immunostaining for tdTomato and Scgb1a1, A-tubulin, Sftpc, CGRP, or Krt5 on lung sections. Yellow arrowheads, tdT+Scgb1a1+ club cells or tdT+Sftpc+ AT2 cells. White arrowheads, tdT+CGRP– cell. (G) Quantification of the percentage of club cells, AT2 cells, AT1 cells, basal cells, ciliated cells, and NE cells expressing tdTomato. Data are presented as mean ± SD; n = 4 mice per group. (H) Schematic showing the experimental strategy. (I) Immunostaining for tdTomato and Scgb1a1 on lung sections of mAce2-2A-CreER;R26-tdTomato mice after 4 wk of naphthalene (naph.) or vehicle (corn oil) treatment. Yellow arrowheads, tdT+Scgb1a1+ cells. (J) Quantification of the percentage of tdTomato+Scgb1a1+ club cells in bronchioles. Data are presented as mean ± SD; *P < 0.05. P value was calculated by unpaired two-tailed Student's t test. n = 4 mice in vehicle group and n = 7 mice in naphthalene group. (K) Cartoon image showing that mAce2+ progenitors contribute to bronchiolar epithelium after bronchiolar damage. (L) A schematic diagram illustrating the experimental strategy. (M) Immunostaining for tdTomato, Sftpc, and T1a on lung sections of mAce2-2A-CreER;R26-tdTomato mice after 4 wk of bleomycin or vehicle (PBS) treatment. Yellow arrowheads indicate tdT+Sftpc+ AT2 cells; White arrowheads indicate tdT+T1a+ AT1 cells. (N) Quantification of the percentage of tdTomato+Sftpc+ AT2 cells and tdTomato+T1a+ AT1 cells in the alveolar region. Data are presented as mean ± SD;*P < 0.05. P value was calculated by unpaired two-tailed Student's t test. n = 4 mice per group. (O) Cartoon image showing that mAce2+ progenitors contribute to alveolar epithelium after alveolar damage. Tam, tamoxifen. tdT, tdTomato. A-tubulin, Acetylated-tubulin. (Scale bars, yellow, 1 mm; white, 100 μm.)

