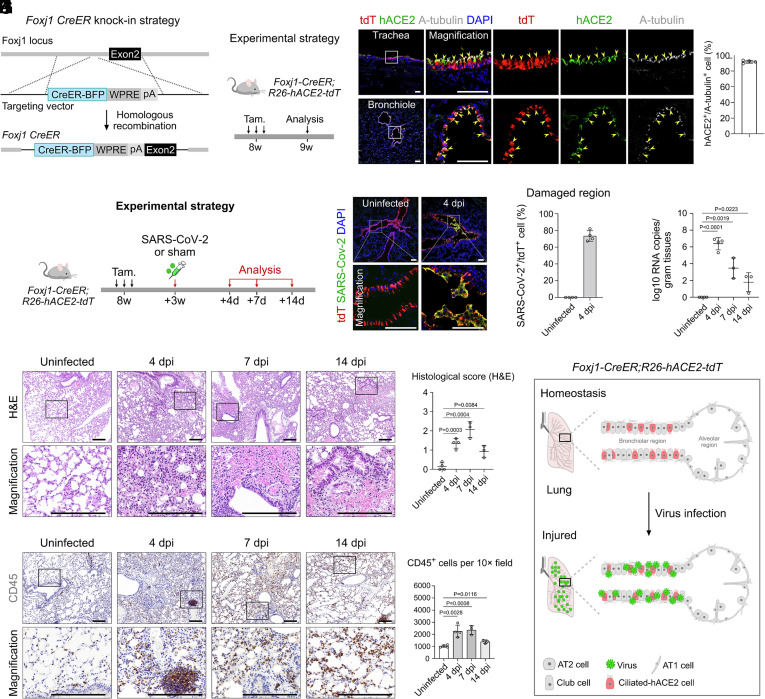
Fig. 4.
Pathological changes after specific infection of bronchiolar ciliated cells by SARS-CoV-2. (A and B) Schematic diagrams illustrating the knock-in strategy of Foxj1-CreER-BFP by homologous recombination (A) and the experimental design (B). (C) Immunostaining for tdTomato, hACE2, and A-tubulin on lung sections of Foxj1-CreER;R26-hACE2-tdT mice. Yellow arrowheads indicate tdT+hACE2+A-tubulin+ ciliated cells. Quantification of the percentage of ciliated cells expressing hACE2. Data are presented as mean ± SD; n = 4 mice per group. (D) A schematic diagram illustrating the virus infection strategy. (E) Immunostaining for tdT and SARS-CoV-2 S protein on lung sections at uninfected and 4 dpi mice. (F) Quantification of the percentage of tdT+ cells infected by SARS-CoV-2 in damaged regions. n = 4 mice per group. (G) RT-qPCR quantification of SARS-CoV-2 ORF gene expression in the lungs in uninfected, 4, 7, and 14 dpi groups. Data are presented as mean ± SD; n = 3 or 4 mice per group. (H) H&E staining of the lung tissues in uninfected, 4, 7, and 14 dpi groups. (I) H&E score of the lung injuries in uninfected, 4, 7, and 14 dpi groups. P value was calculated by unpaired two-tailed Student's t test. Data are presented as mean ± SD; n = 3 or 4 mice per group. (J) IHC staining for CD45+ immune cells of lungs in uninfected, 4, 7, and 14 dpi groups. (K) Quantification of the cell number of CD45+ immune cells of uninfected and infected lung tissues. P value was calculated by unpaired two-tailed Student's t test. Data are presented as mean ± SD; n = 3 or 4 mice per group. (L) Cartoon image showing that specific expression of hACE2 in ciliated cells results in lung pneumonia after SARS-CoV-2 infection. Tam, tamoxifen. tdT, tdTomato. A-tubulin, Acetylated-tubulin. (Scale bars, yellow, 1 mm; white, 100 μm; black, 200 μm.)

