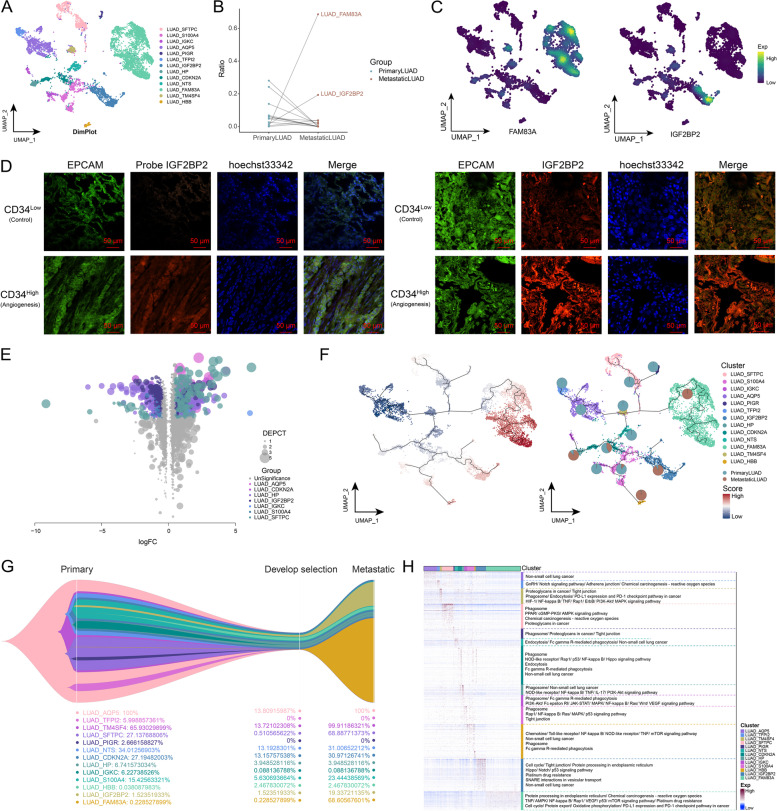
Fig. 2.
Clonal evolutionary trajectory of metastatic LUAD cells. A The single cell atlas showing tumor cell subpopulations. B Dotted line graph showing the ratio of distinct tumor cell subpopulations in control, primary and metastatic LUAD. C The single-cell atlas mapping the expression of FAM83A and IGF2BP2 in tumor cells. D Fluorescence assay-fluorescent probe assay showing IGF2BP2 in LUAD tissues with high or low CD34 expression. Bar, 50 μm. E Volcano map showing differentially expressed genes in malignant cells and their subpopulations between metastatic and primary LUAD. F The single-cell atlas mapping the pseudotime values and evolutionary trajectory. G Evolutionary tree showing the evolutionary trajectory of tumor cells. H Heat map-pathway showing signaling pathways involved in temporally relevant genes

