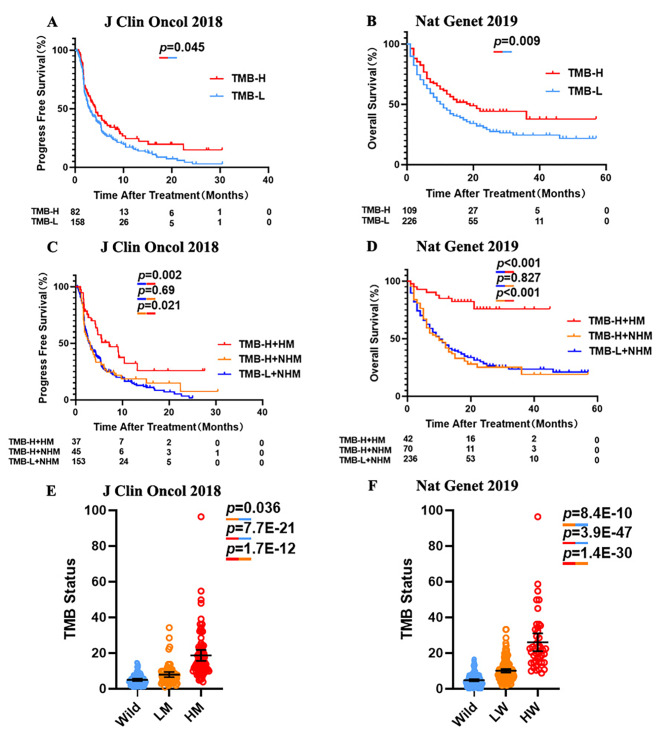
Fig. 3.
Comparation of predictive powers of 20-gene mutation signature with TMB level. (A) PFS levels of the NSCLC patients with high (≥ 10) and low (< 10) TMB values. (B) OS levels of the NSCLC patients with high (≥ 10) and low (< 10) TMB values. (C) PFS levels in the ICI treated NSCLC patients with TMB-H (≥ 10) and TMB-L (< 10) further stratified according to groups with high mutation signature (HM) or with no high mutation signature (NHM). (D) OS levels in the ICI treated NSCLC patients with TMB-H (≥ 10) and TMB-L (< 10) further stratified according to groups with high mutation signature (HM) or with no high mutation signature (NHM). (E) TMB levels in NSCLC patients [MSKCC, J Clin Oncol 2018] with different mutation signatures. (F) TMB levels in NSCLC patients [MSKCC, Nat Genet 2019] with different mutation signatures.P-values calculated by use of log-rank test (A,B,C,D) or unpaired t-test (E, F)

