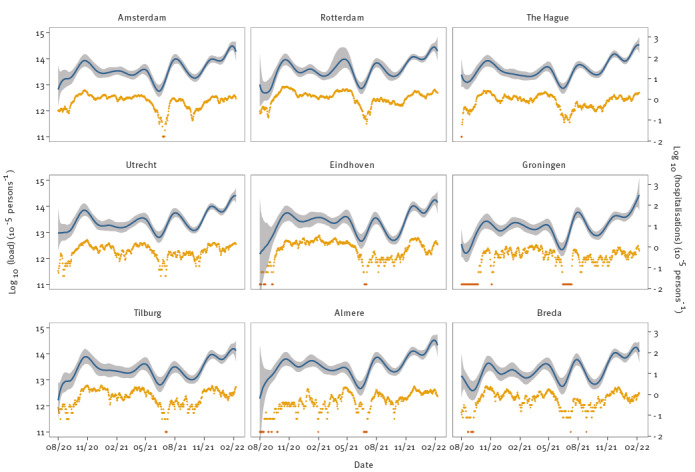
Figure 4.
Estimated log-transformed SARS-CoV-2 loads for the nine largest municipalities in the Netherlands with log-transformed number of hospitalisations, the Netherlands, August 2020–February 2022 (n = 19,146 hospital admissions)
SARS-CoV-2: severe acute respiratory syndrome coronavirus 2.
Yellow dots: virus load measurements; lines: posterior median of the STP-weighted national virus load with associated 95% credible band (shaded). Hospitalisations are retrieved from the Dutch open data [31]. Hospitalisations are shown as a 7-day centred moving average to smooth out day-of-week effects, and zero incidences are plotted in red. Notable events in the period October 2020 to February 2022 include a vaccination campaign starting in January 2021 and a campaign for booster vaccination starting in November 2021. Furthermore, the SARS-CoV-2 Alpha, Delta and Omicron variants were successively dominant in the Netherlands and responsible for most infections from February 2021, June 2021 and December 2021, respectively. Hospitalisations in Amsterdam include those from Weesp as those municipalities were merged in March 2022 and the open data we used had been retroactively modified as a result. The total number of persons in these nine municipalities was 3,508,948, representing 20.2% of the population [13]. Dates on the x-axis are given in numeric format, i.e. month/year.