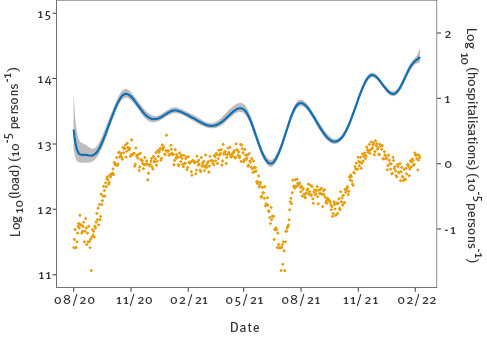
Figure 5.
Estimated national log-transformed SARS-CoV-2 loads in sewage with national log-transformed daily number of hospitalisations, the Netherlands, August 2020–February 2022 (n = 82,103 hospital admissions)
SARS-CoV-2: severe acute respiratory syndrome coronavirus 2.
The blue line shows the posterior median of the STP-weighted national virus load with associated 95% credible band (shaded), and the yellow dots represent the daily number of hospital admissions [31]. Dates on the x-axis are given in numeric format, i.e. month/year.

