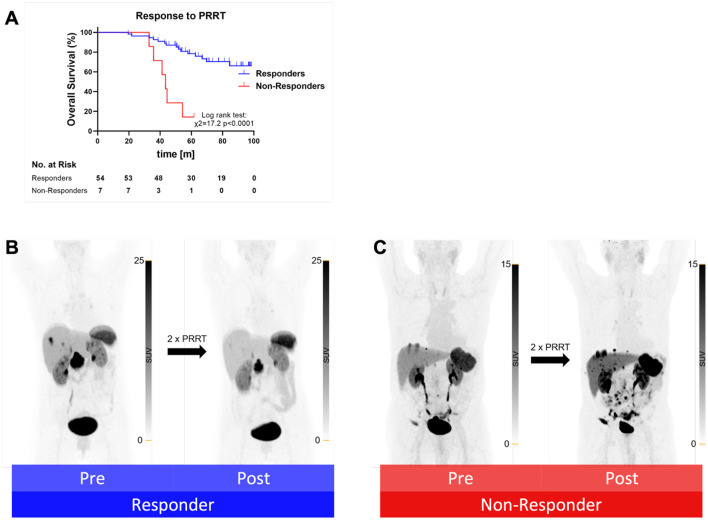
Figure 2.
(A) Kaplan–Meier curves for overall survival separated by responders (blue) to PRRT after two cycles and non-responders (red) after two cycles. m, months. Exemplary the maximum intensity projection (MIP) of a PET from a responder (B) and a non-responder (C) pre and post two cycles of PRRT.

