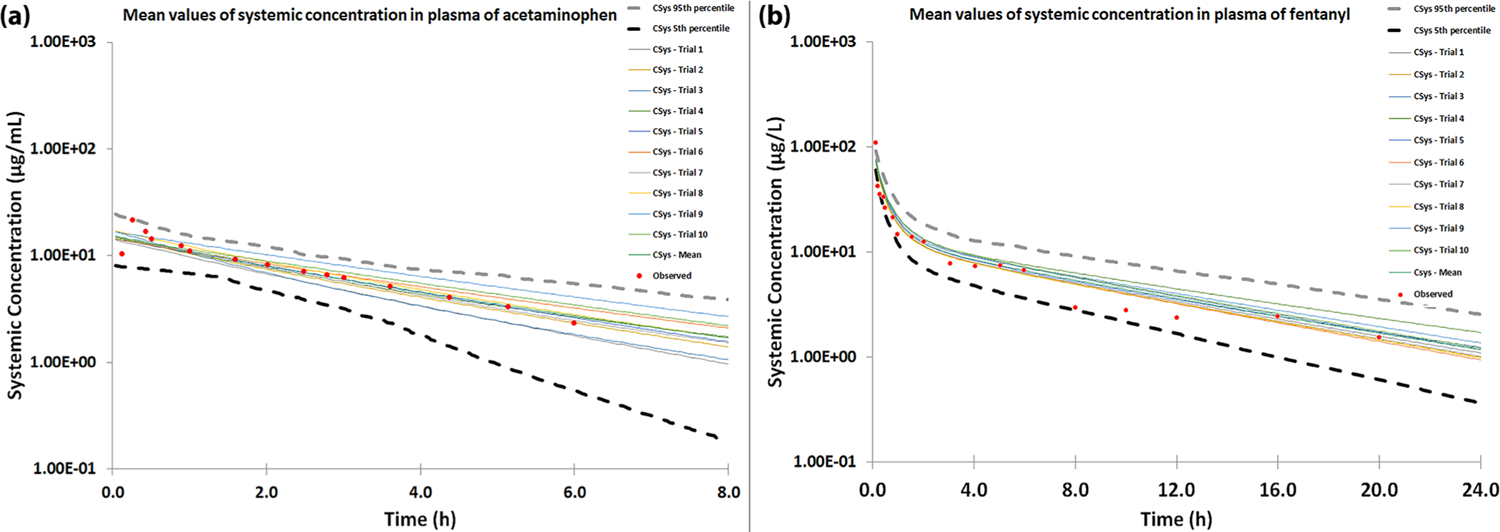
Figure 8.

Observed and simulated concentration–time profiles of (a) acetaminophen 1000 mg iv bolus and (b) fentanyl 7 mg iv bolus. The simulated results were generated using 10 trials of 10 virtual healthy volunteers. Observed data are highlighted in red dots, while the simulated results, mean value, and 95th/5th percentile of the simulation are shown by corresponding lines.
