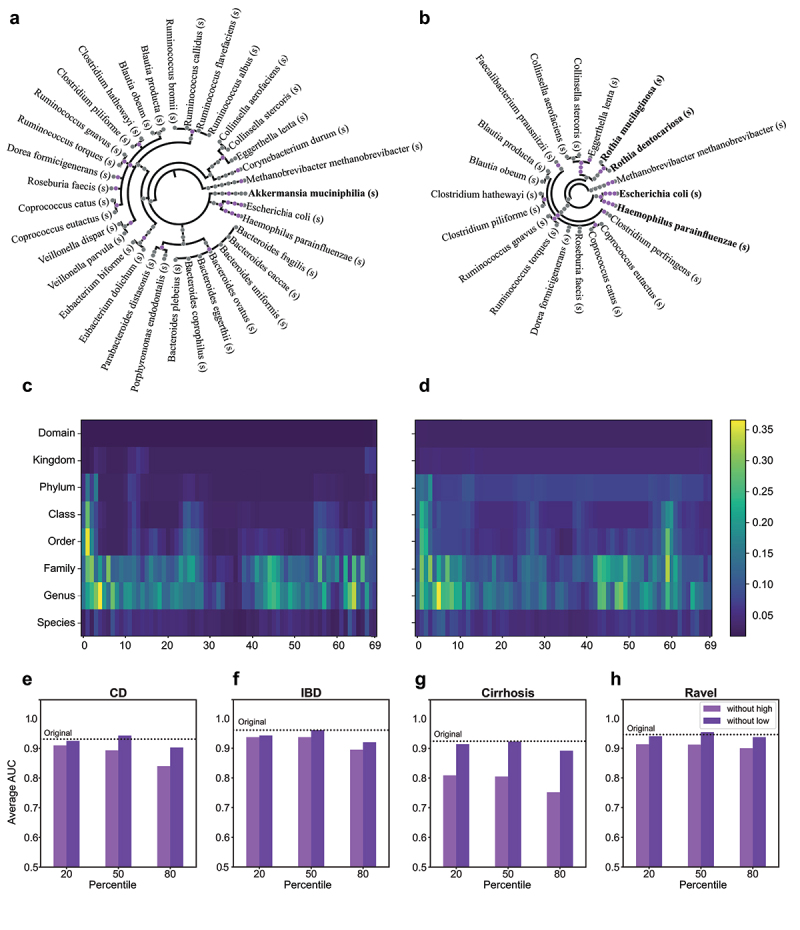
Figure 3.

Interpretation of iMic’s results.
(a, b) Cladogram projections: To visualize the taxa contributing to each class, the healthy class (a) and the CD class (b), we projected the most significant microbes back on the cladogram. The purple points on the cladograms represent taxa that are in the top decile of the gradients. The taxa in bold are important taxa that are consistent with the literature. (c, d) Grad-Cam images: Each image represents the average contribution of each input value to the gradients of the neural network back-propagation, as computed by the Grad-Cam algorithm. We put the Grad-Cam after the first CNN layer. The results presented here are from the CD dataset. (c) represents the average gradients for the healthy subjects of the cohort and (d) represents the average gradients for the CD subjects. The color reflects the average values of the gradients, such that the blue colors represent low gradients, and the yellow colors represent the high gradients, using the ‘viridis’ colormap. The differences between the two heatmaps represent the contribution of different taxa to the prediction of different phenotypes. Note that the main contribution to the classification is at the genus and family level (rows 6 and 5). Similar results were obtained for the other datasets (Fig. S11 in Supp. Mat.) (e-h). Interpretation tests on the CD dataset (e), the IBD dataset (f), the Cirrhosis dataset (g), and the Ravel dataset (h). Average AUC values over 10 CVs on the external test set. The x-axis represents the fraction of removed columns. The dark bars represent the performance when all of the columns with Grad-Cams values lower than this fraction have been removed and the light bars represent the performance when the columns with scores above this fraction have been removed. The black line represents the average AUC over 10 CVs of the original model with all the input columns. Results from the other datasets were similar, see Supp. Mat Fig. S11. Removing the top scoring columns always reduced the performance. Removing the bottom scoring columns increases or does not change the AUC.
