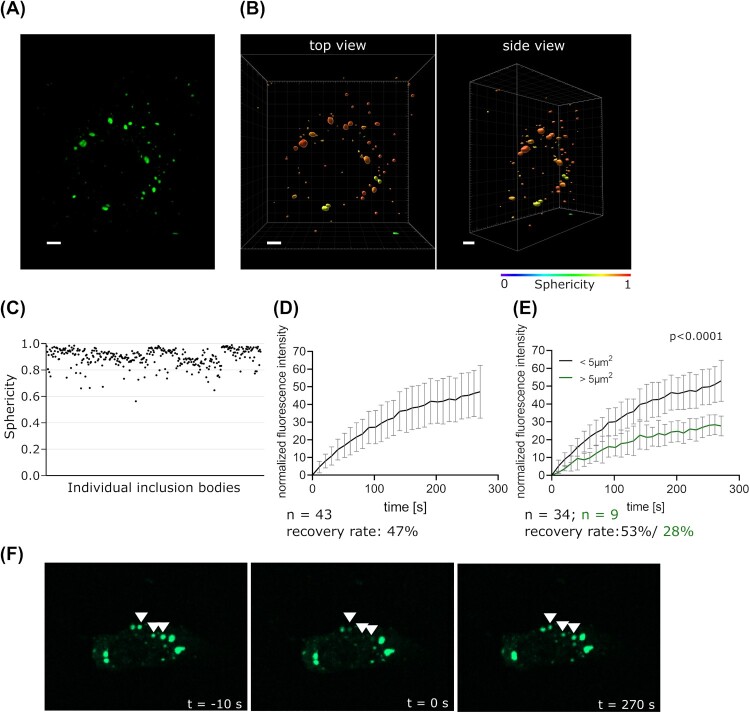
Figure 1.
Characterization of liquid properties of EBOV IBs. (a) Representative fluorescence microscopy image of IBs (green) in an rgEBOV-VP30-GFP infected cell at 14 hours post infection. (b) Three-dimensional segmentation of the VP30-GFP signal of the same cell shown colour-coded according to sphericity. Scale bar = 5 µm. (c) Scatter plot of the sphericity of all segmented IBs (n = 344). (d) Fluorescence recovery of IBs. Cells were infected with rgEBOV-VP30-GFP at an MOI of 1, and at 16 hours post infection individual, whole IBs (marked with arrowheads) were photobleached and fluorescence recovery was monitored. (e) Quantification of fluorescence recovery of smaller (projected area < 5 µm2) and larger IBs (projected area > 5 µm2). p values of differences analysed by two-way ANOVA are shown. (f) Images of photobleached IBs 10 seconds before bleaching, immediately after bleaching (0 seconds), and 270 seconds after bleaching.

