
Figure 1.
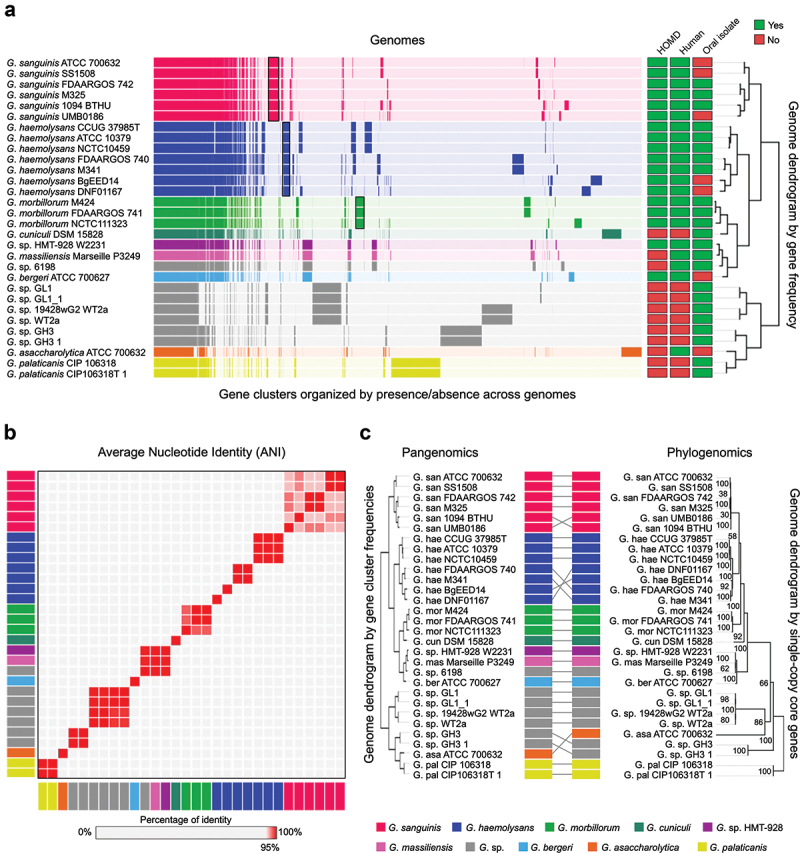
Gemella genomes cluster into species-level groups. A) Pangenome constructed from all (n = 30) available NCBI RefSeq Gemella genomes. Gene clusters are colored by species and arranged based on their presence or absence across the genomes. Genomes are hierarchically clustered based on gene cluster frequency, i.e. the number of representatives of each gene cluster (n = 6,922) present in each genome. Metadata columns indicate whether the species is included in HOMD, if the genome is of human origin, and if it was isolated from an oral site. Black boxes show gene clusters unique to G. sanguins, G. haemolysans and G. morbillorum. b) Average nucleotide identity (ANI) comparison of genomes in pangenome. ANI represents the genome-level similarity at the nucleotide level between any two genomes. Rectangle color indicates species as in A. Order of genomes is same as in the pangenome dendrogram. Color scale denotes genome similarity; 100% is red; below 95% is light grey. c) Pangenomic and phylogenomic tree comparison. Rectangle color indicates species as in A. The phylogenomic tree was constructed using maximum-likelihood with 17 concatenated single-copy core genes.