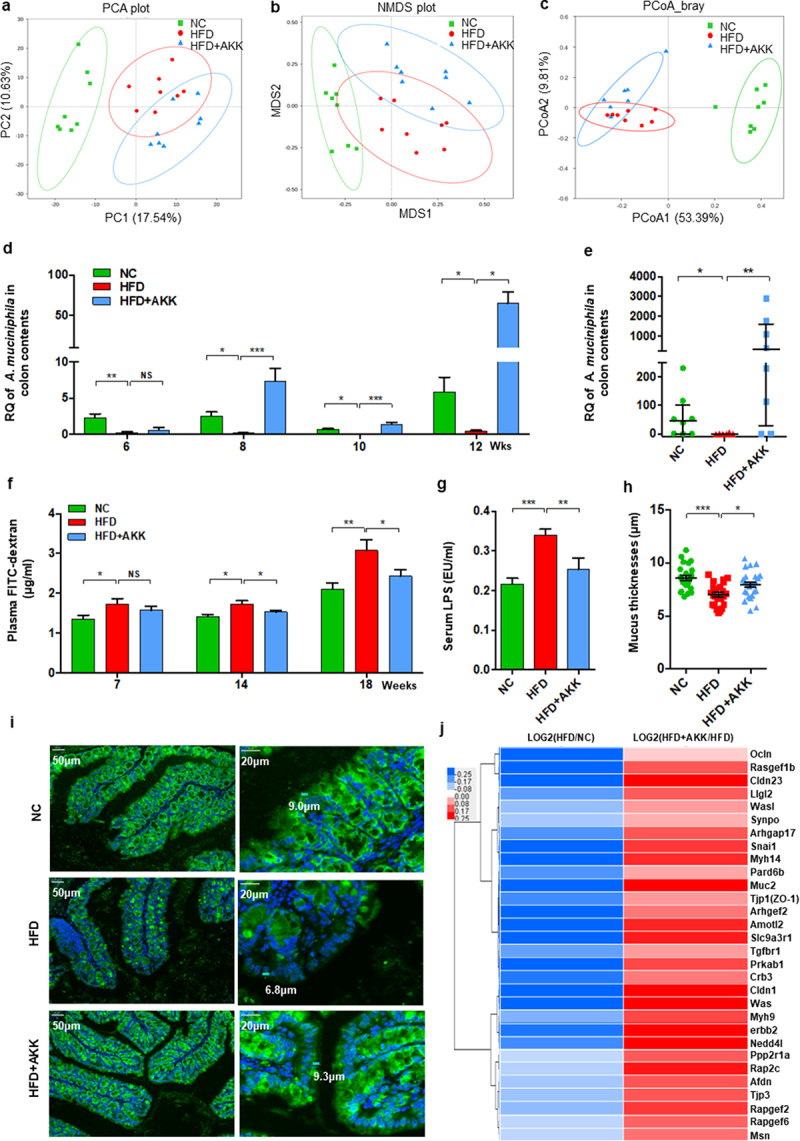
Figure 5.

Recovery of Akkermansia muciniphila protected against intestinal barrier failure in HFD-fed NASH mice. (a) PCA score plot. (b) NMDS score plot. (c) PCoA score plot based on Bray‒Curtis distance matrices. Each spot represents one sample. Green, NC; Red, HFD; Blue, HFD+AKK. (d) Continuous monitoring to determine the colonization of Akkermansia muciniphila. (e) the relative abundance of Akkermansia muciniphila at 20 weeks was determined by qPCR. n = 8 mice/group. (f) in vivo gut permeability was determined by measurement of plasma concentrations of FITC-dextran (4 kDa) at 7, 14, and 18 weeks of treatment. (g) ELISA to measure serum LPS concentrations at 19 weeks of treatment. (a-d) n = 8 mice/group. (h and i) Quantitative analysis of mucus thickness (h) and representative image of mucin expression in the colon by immunofluorescent staining in paraffin sections (i). Muc2, green; DNA, blue. Scale bar, ×400 (left), ×800 (right). Pictures are representative of 5 biological replicates. (j) Heatmap of differentially expressed genes in the tight junction pathway between the HFD and HC groups or the HFD+AKK and HFD groups. The log2 (fold change) values were calculated from the fragments per kilobase of transcript per million (FPKM) values of RNA sequencing. n = 3/group. Data are shown as the mean ± SEM or the median with interquartile range. p values were determined using one-way ANOVA. *p < 0.05, ** p < 0.01, *** p < 0.001. Groups: NC, normal chow control; HFD, high-fat diet; HFD + AKK, high-fat diet and oral treatment with Akkermansia muciniphila.
