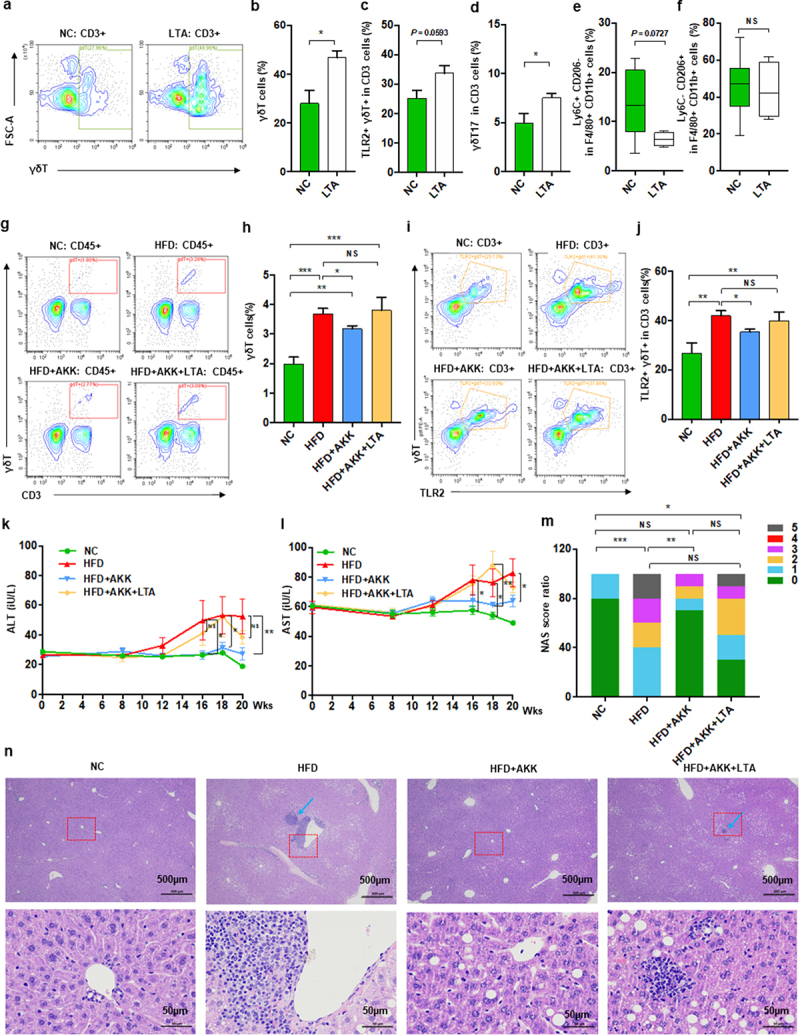
Figure 7.

Akkermansia muciniphila decreased hepatic γδT cells by downregulating TLR2 in NASH mice. (a) Representative flow cytometric analysis. The percentages of hepatic γδT cells (b), IL − 17+ γδT cells (c), TLR − 2+ γδT cells (d), proinflammatory macrophages (e) and anti-inflammatory macrophages (f) after lipoteichoic acid (LTA) treatment alone were quantified by flow cytometry. Plots were gated on CD3+ T cells. n = 5 mice/group. (g) Representative flow cytometric analysis and (h) percentages of hepatic γδT cells after LTA and Akkermansia muciniphila treatment were quantified by flow cytometry. Plots were gated on CD45+ cells. (i) Representative flow cytometric analysis and (j) percentages of hepatic TLR − 2+ γδT cells were quantified by flow cytometry. Plots were gated on CD3+ T cells. (g-j) n = 8 or 5 mice/group. (k and l) the levels of serum ALT and AST were measured at 8, 12, 16, 18 and 20 weeks. (m) Representative images of hepatic hematoxylin & eosin (H&E) staining. Scale bar, ×40 (left), ×400 (right). The blue arrows indicate the steatohepatitis foci of inflammation with clusters of inflammatory cells. (n) Proportion chart diagram of the liver NAFLD activity score (NAS) ratio. Data are shown as the mean ± SEM or the median with interquartile range. p values were determined using one-way ANOVA or the Kruskal‒Wallis test. *p < 0.05, ** p < 0.01, *** p < 0.001. Groups: NC, normal chow control; HFD, high-fat diet; HFD + AKK, high-fat diet and oral treatment with Akkermansia muciniphila; HFD + AKK + LTA, high-fat diet and intraperitoneal injection with LTA and oral treatment with Akkermansia muciniphila; LTA, normal chow diet and intraperitoneal injection with LTA.
