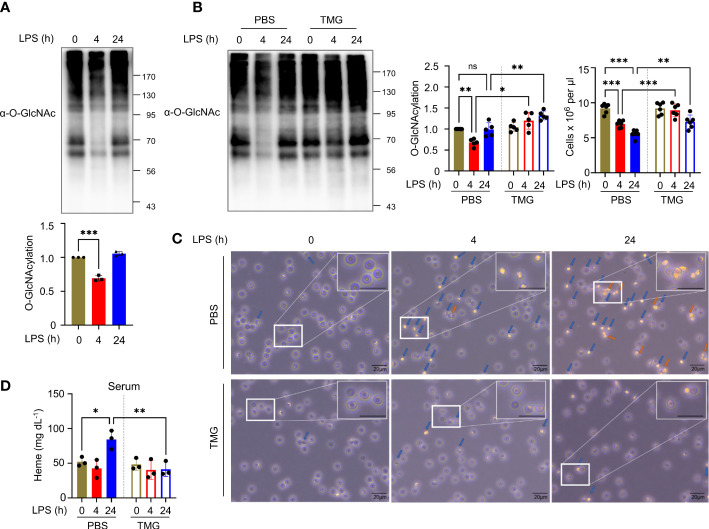
Figure 1.
Reduced O-GlcNAcylation of erythrocytes in LPS-injected mice is involved in erythrocyte destruction. (A) Western blot analysis showing the levels of O-GlcNAcylation in erythrocytes at various times after i.p. injection with 10 mg kg-1 day-1 LPS (lipopolysaccharide from Escherichia coli O111:B4). Cellular O-GlcNAcylation was normalized to GAPDH. (n=3) (B) Western blots showing the levels of O-GlcNAcylation in erythrocytes at the indicated times after i.p. injection with 10 mg kg-1 day-1 LPS and 40 mg kg-1 day-1 Thiamet-G (TMG) or the same volume of PBS (as a control). In the left graph, cellular O-GlcNAcylation was normalized to GAPDH. In the right graph, the number of erythrocytes isolated from whole blood obtained from the indicated groups of mice is shown by cell counting analyses. (n=5) (C) Light microscopy (LM) showing changes in the shape of erythrocytes. Before LM observations, erythrocytes obtained from LPS-injected mice (10 mg kg-1 day-1) with TMG (40 mg kg-1 day-1) or PBS (as a control) administration was incubated in RPMI-1640 for 30 min. blue arrows; abnormal morphologies, orange arrows; aggregate. The enlarged area was selected from the original at 400x magnification. Scale bar, 20 μm. (D) Heme assay to measure the concentration of free heme released into the serum. Serum was harvested at the indicated times after i.p. injection with 10 mg kg-1 day-1 LPS and 40 mg kg-1 day-1 TMG or the same volume of PBS (as a control). (n=3) (A, B, D; one-way ANOVA with Sidak’s multiple comparisons test). Data are presented as the mean ± standard deviation (SD); statistical significance was annotated as *P < 0.05; **P < 0.01; ***P < 0.001.

