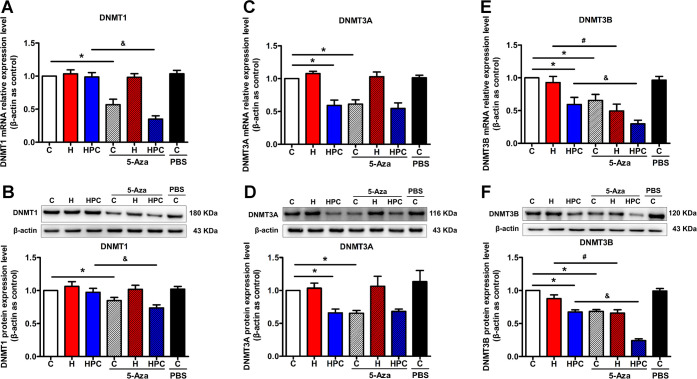
Figure 4.
Effects of 5-Aza on DNMT expression in the hippocampus of ICR mice. After 5-Aza treatment, changes in DNMT1 (A), DNMT3A (C), and DNMT3B (E) mRNA expressions of control, hypoxia, and HPC mice were analyzed by qPCR and changes in DNMT1 (B), DNMT3A (D), and DNMT3B (F) protein expressions of control, hypoxia, and HPC mice were analyzed by western blot. The data are presented as mean ± SEM, n = 6 for each group. Compared with the control group: *P < 0.05. Compared with the hypoxia group: #P < 0.05. Compared with the HPC group: &P < 0.05.

