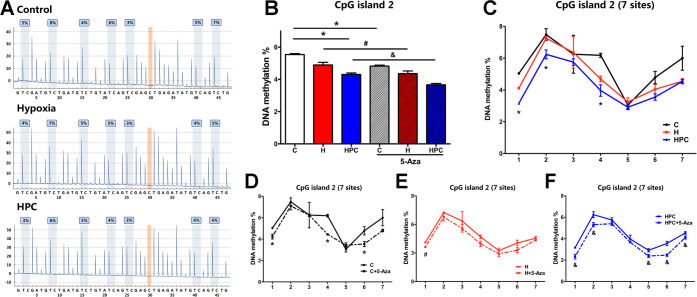
Figure 6.
Analysis of DNA methylation measured by pyrophosphate sequencing in CpG island 2 of the BDNF gene promoter. (A) Representative pyrophosphate sequencing analysis of control, hypoxia, and HPC groups. (B) Global DNA methylation of CpG island 2 in the different groups. (C) DNA methylation at seven sites of CpG island 2 in control, hypoxia, and HPC groups. Before and after 5-Aza treatment, the DNA methylation at seven sites of CpG island 2 in the control group (D), hypoxia group (E), and HPC group (F). The data are presented as mean ± SEM, n = 3 for each group. Compared with the control group: *P < 0.05. Compared with the hypoxia group: #P < 0.05. Compared with the HPC group: &P < 0.05.

