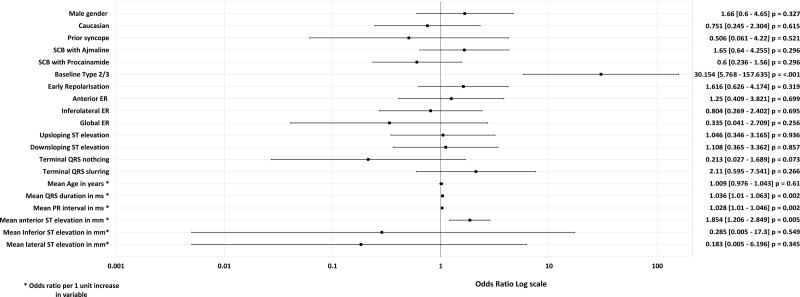
Figure 2.
Univariate analysis for the development of the drug-induced type 1 Brugada pattern (DI-T1BP). A Forrest plot displaying the odds ratios obtained from the univariate analysis of baseline clinical and electrocardiographic characteristics and sodium channel blockade. A baseline type 2/3 Brugada pattern demonstrated a statistically significant association with the development of the type 1 Brugada pattern, P≤0.05. The mean baseline PR interval (ms) and QRS duration (ms) were significantly longer in SCBP+ vs SCBP– patients. ER indicates early repolarization; and SCBP, sodium channel blockade.

