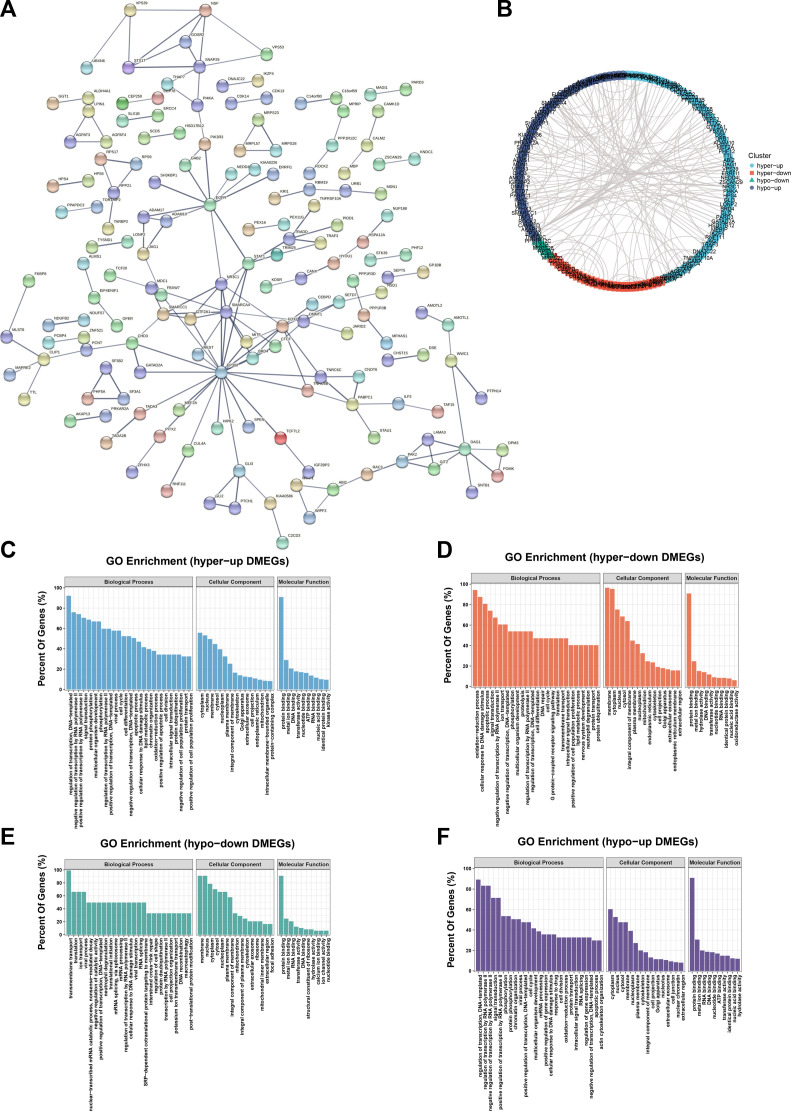
FIGURE 6.
PPI networks and hub genes were found in DMEG. (A) PPI network of DMEG constructed from STRING database (B) Cytoscape was performed divided into four clusters. Blue represents hyper-up genes, orange represents hyper-down genes, green represents hypo-down genes, and purple represents hypo-up genes. (C) GO enrichment analysis of the hyper-up cluster in this DMEG. (D) GO enrichment analysis of hyper-down clusters in this DMEG. (E) GO enrichment analysis of the hypo-down cluster in this DMEG. (F) GO enrichment analysis of the hypo-up cluster in this DMEG.

