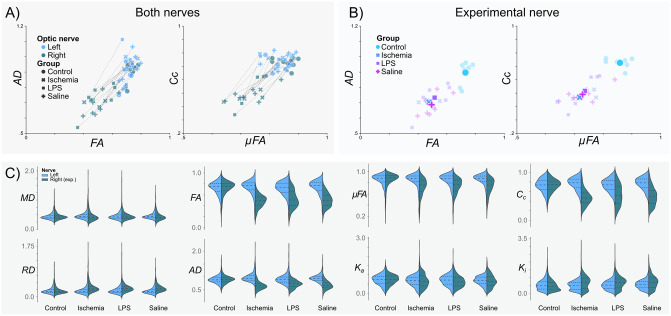
Fig 5. Q-space trajectory imaging metrics by experimental group.
A) Intact (Left) vs Experimental (Right) optic nerves. Data points correspond to the average values of all voxels of each optic nerve, per subject. Lines connect the two optic nerves of each subject. B) Right (experimental) optic nerves’ metrics color-coded according to the experimental procedure. Semi-transparent markers show average values per animal; average values for each experimental condition are indicated as large solid markers. C) Violin plots for the different experimental groups for each QTI metric.

