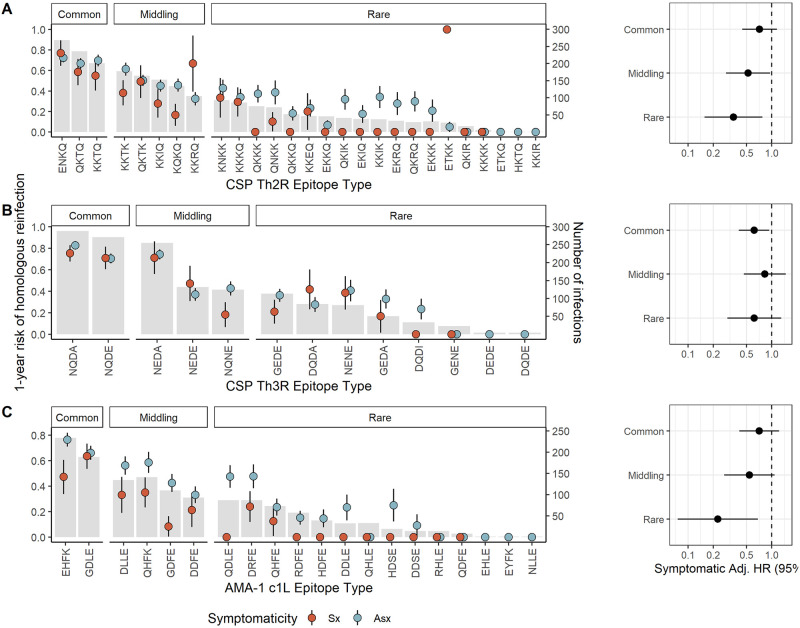
Fig 5. Prevalence of epitope types and time to homologous reinfection following asymptomatic and symptomatic infections.
Left: Gray bars indicate the number of infections harboring each CSP-Th2R (A), CSP-Th3R (B), or AMA-1 c1L (C) epitope type (right y-axis). Dots indicate the proportion of each index infection harboring the epitope type that was followed by homologous reinfection after 1 year (left y-axis) for either symptomatic (red) or asymptomatic (blue) index infections, with lines as standard error. Right: Adjusted Hazard Ratios for symptomatic index infections estimated by multivariate mixed effects Cox proportional hazards models for reinfection by parasites bearing homologous CSP-Th2R epitopes (A), CSP-Th3R (B), or AMA-1 c1L (C) epitopes that are individually classified as common, middling, and rare, as indicated in the bar plot. Hazard ratios adjusted for age, epitope type prevalence, gender, and transmission season. Circles indicate adjusted HRs, and bars show the 95% CIs. Adj. HR, Adjusted Hazard Ratio.

