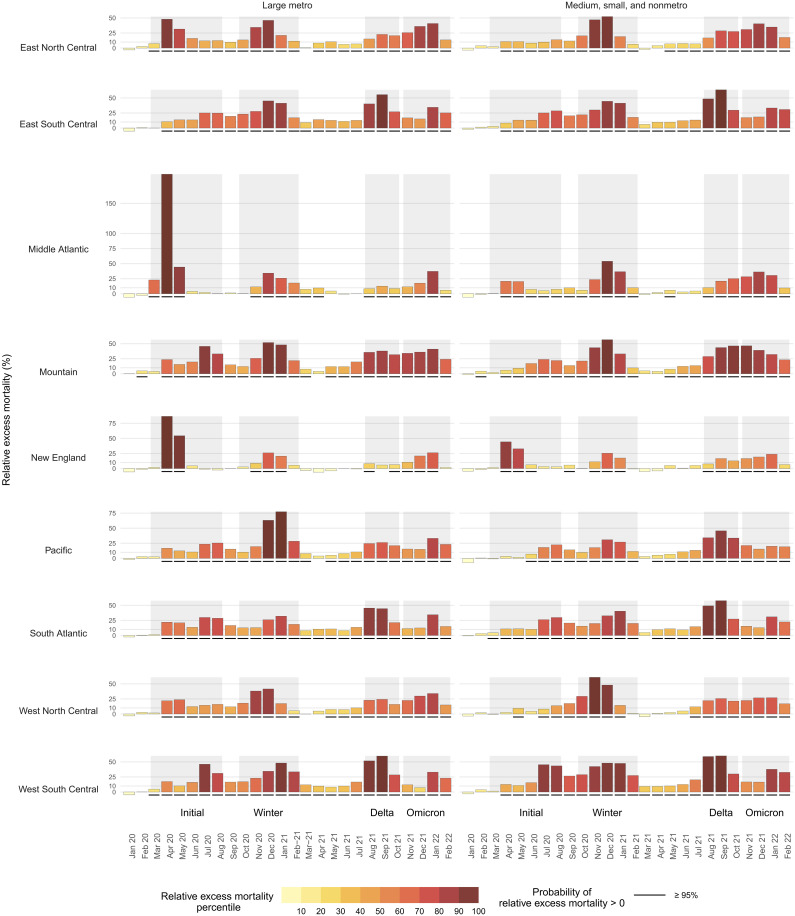
Fig. 3. Temporal trends in relative excess mortality by census division and metro-nonmetro category, March 2020 to February 2022.
The large metro category includes large central metros and large fringe metros. All nonlarge metro counties are classified as medium metros, small metros, and nonmetro areas. The shaded intervals behind the bars separate the different waves of the COVID-19 pandemic as follows: Initial (March 2020 to Aug 2020), Winter (October 2020 to February 2021), Delta (August 2021 to October 2021), and Omicron (November 2021 to February 2022). The height of each bar reflects relative excess mortality (excess deaths as a percentage of expected deaths). The color of the bars reflects each division-month position (percentile) in the overall distribution of relative excess mortality. Black, solid segments below the bars indicate units for which the posterior probability of positive excess mortality is above 95%.

