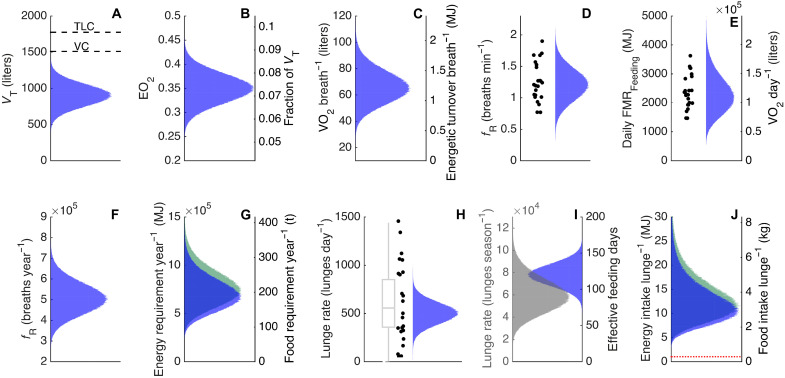
Fig. 3. Modeled food consumption of humpback whales.
Estimating consumption from breathing rate involves several parameters that are not precisely known for humpback whales. Each plot indicates the probable distribution of a parameter based on measurements (black dots) and information in the literature. All plots assume a body mass of 30 t. (A) Tidal volume with total lung capacity (TLC) and vital capacity (VC) displayed as black lines. (B) Oxygen extraction coefficient (EO2). (C) The VO2 per breath and energetic turnover per breath (MJ). (D) Breathing rate (breaths min−1) (fR). Black dots represent breathing rates from current study. (E) Daily field metabolic rate (FMR) of feeding humpback whales. Black dots represent calculated daily FMR for each feeding whale in current study. (F) Simulated total breath count during a year, based on breathing rates on feeding and breeding grounds and simulated breathing rates for migrating whales (fig. S8). (G) Annual energy expenditure for a pregnant female humpback whale (green) and nonpregnant adult (blue) based on the total yearly breath count (MJ). (H) Daily lunge rate. Black dots represent data from current study, and gray boxplot represents modeled feeding rates of humpback whales from a previous study (11). (I) Effective feeding days, the days spent feeding while on the feeding grounds and yearly lunge rate. (J) Required energy intake per lunge to cover annual energy expenditure during feeding, migration, and breeding periods for a pregnant female humpback whale (green) and nonpregnant adult (blue). The red line represent the break-even cost of a lunge.

