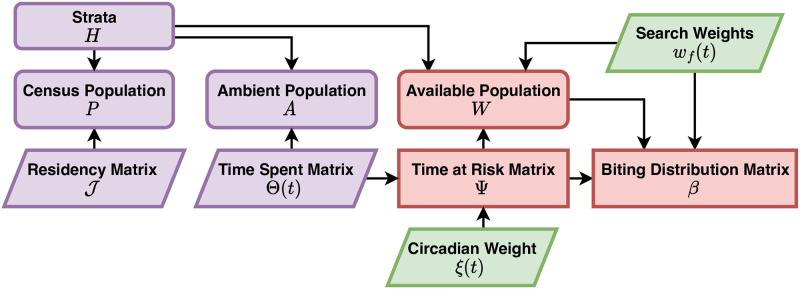
Fig 2. Denominators and mixing.
A schematic diagram relating various concepts of population density under a model of human mobility, resulting in a biting distribution matrix, β. Here, and and in Figs 3–6, rounded rectangles denote endogenous state variables, sharp rectangles denote endogenous dynamical quantities, and parallelograms represent exogenous data or factors. Purple indicates the element is related to human populations, green for mosquitoes, and red for biting and transmission. Population strata (H) describe how persons are allocated across demographic characteristics. The matrix distributes these strata across space (patch), according to place of residency. By combining information on how people spend their time across space (Θ(t)) and mosquito activity (ξ(t)) a time at risk (TaR) matrix Ψ is generated describing how person-time at risk is distributed across space. Because blood feeding can be modified by human and mosquito factors (e.g., net use and biting preferences), search weights (wf(t)) may further weight person-time at risk. The final result is a biting distribution matrix β, which is the fraction of each bite in each patch that would arise on an individual in each stratum, so diag(H) ⋅ β = 1.

