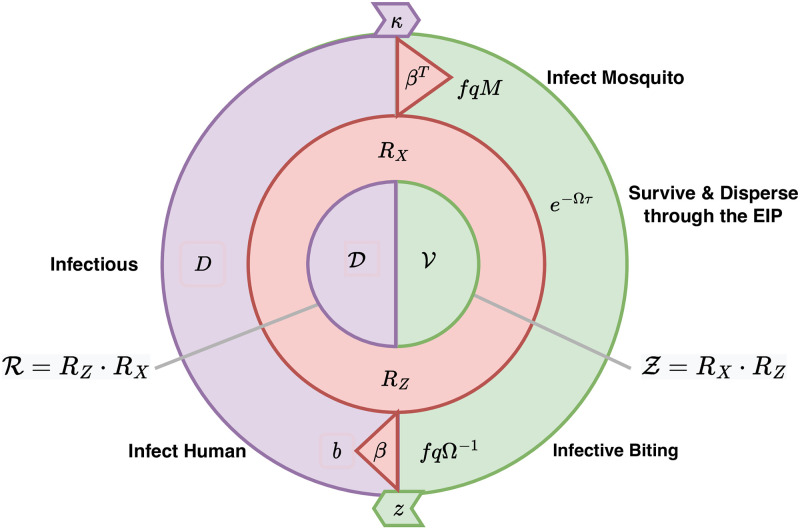
Fig 7. A spatial life-cycle model.
A diagram that illustrates how the parameters describing each stage in the parasite’s life-cycle translate into a parasite’s reproductive success spatially, when mosquitoes and hosts move. The right half of the circle represents mosquitoes and the left half humans. The flow of events is clockwise. Mosquitoes must blood feed to become infected (fqM), and then survive and disperse through the EIP (e−Ωτ). infectious bites are distributed as long as a mosquito survives, while it blood feeds and disperses (fqΩ−1). The bites are distributed among humans (β) and some of them cause an infection (b). Parasites are transmitted for as long as humans remain infectious, measured in terms of the human transmitting capacity (HTC, or D days). Infectious humans are distributed wherever humans spend time at risk (affecting β). These processes are summarized differently to model parasite dispersal and parasite reproductive success. Dispersal counts from bite to bite using the VC matrix () and the HTC matrix (). Threshold computations count from when a host becomes infectious to measure a parasite’s reproductive success in infectious mosquitoes (RZ); in infectious humans (RX); from human to humans among strata after a human becomes infectious (); and from mosquito to mosquitoes (). R0 is the lead eigenvalue of or . Under endemic conditions, we can also consider how frequently parasites are actually transmitted by including the probability a mosquito gets infected κ, and the probability a mosquito is infectious, given by the sporozoite rate z.

