Figure 6.

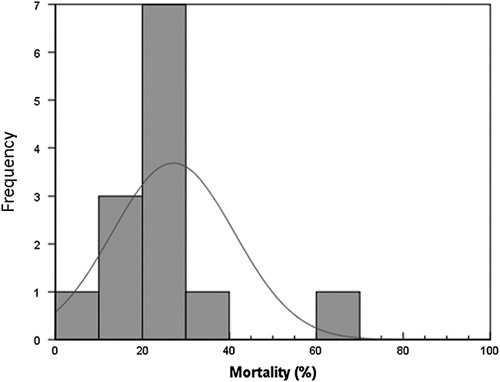
Percent mortality graph; only studies that reported mortality were included in this graph; frequency is the frequency with which a particular mortality value [in percentage] was reported in our studies.

Percent mortality graph; only studies that reported mortality were included in this graph; frequency is the frequency with which a particular mortality value [in percentage] was reported in our studies.