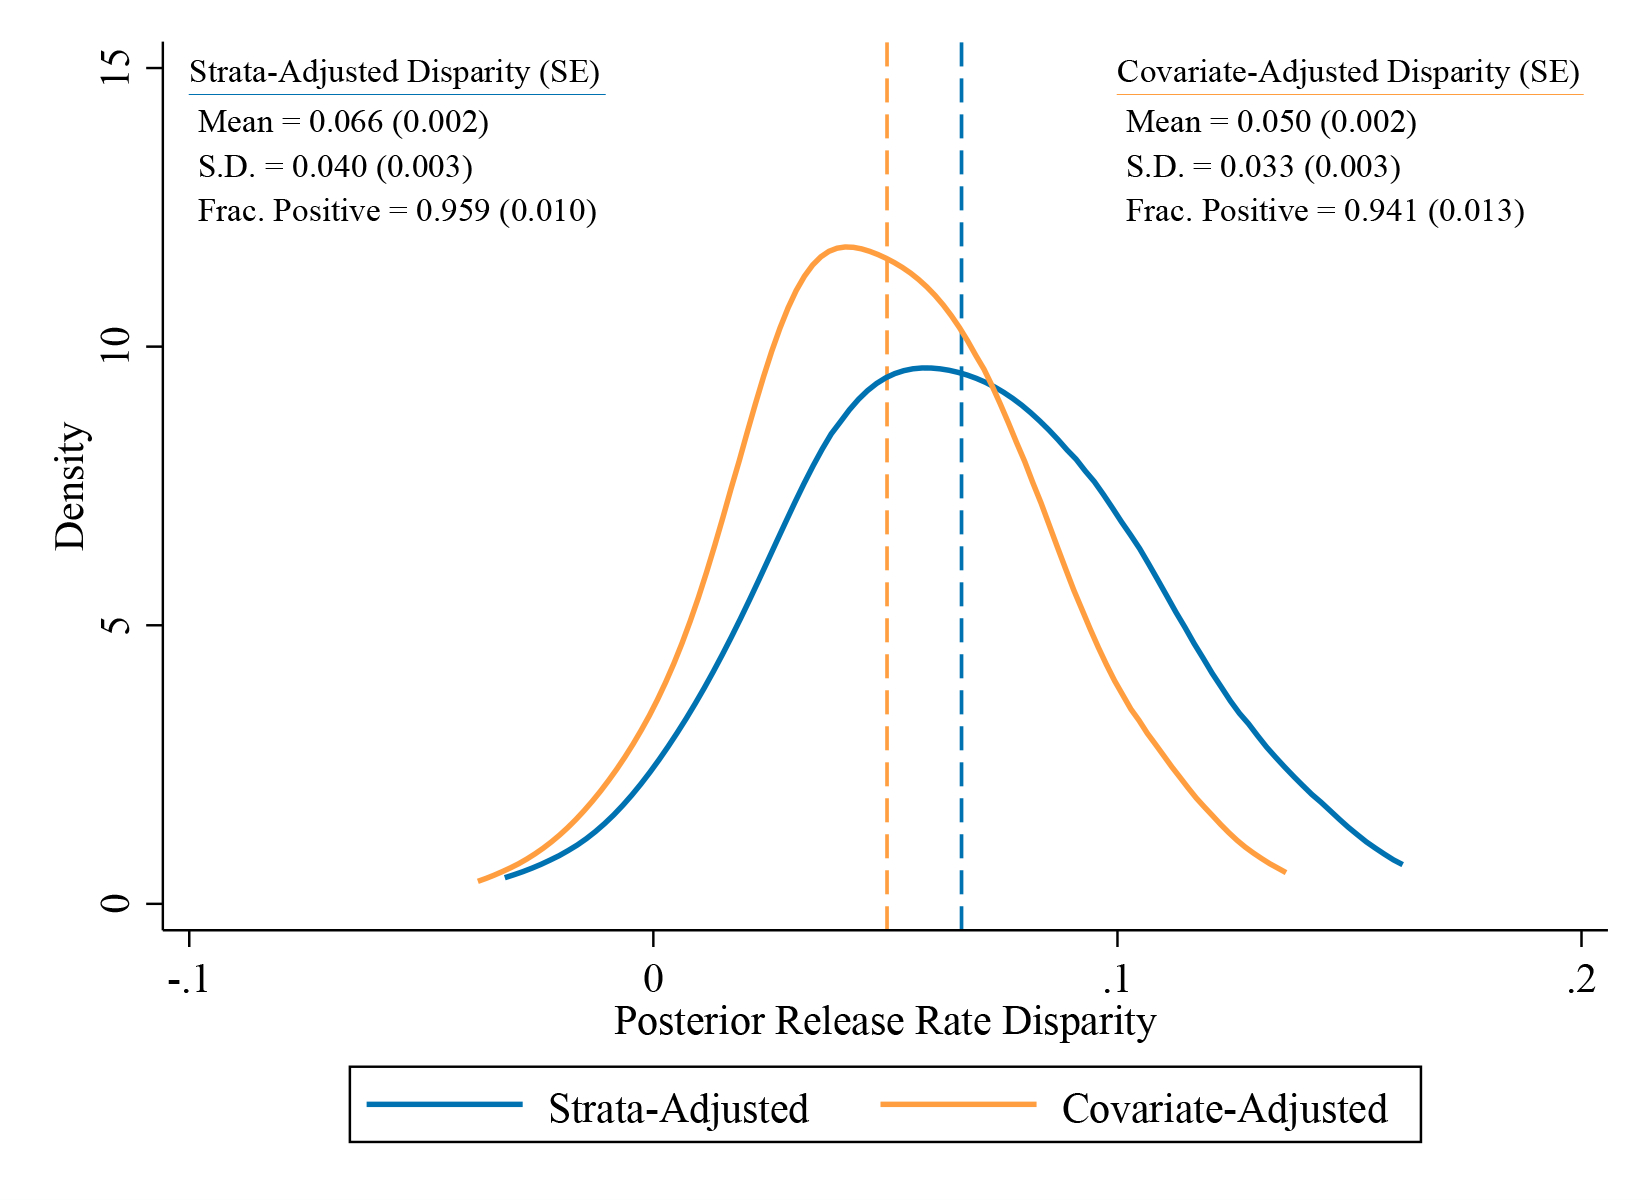
Figure 1:

Observational Release Rate Disparities
Notes. This figure plots the posterior distribution of observational release rate disparities for the 268 judges in our sample. We estimate disparities by OLS regressions of an indicator for pretrial release on white×judge fixed effects, controlling for judge main effects. The strata-adjusted disparity regression controls only for the main judge fixed effects and court-by-time fixed effects. The covariate-adjusted disparity regression adds the baseline controls from Table 2. The distribution of judge disparities, and fractions of positive disparities, are computed from these estimates as posterior average effects; see Appendix B.3 for details. Means and standard deviations refer to the estimated prior distribution.
