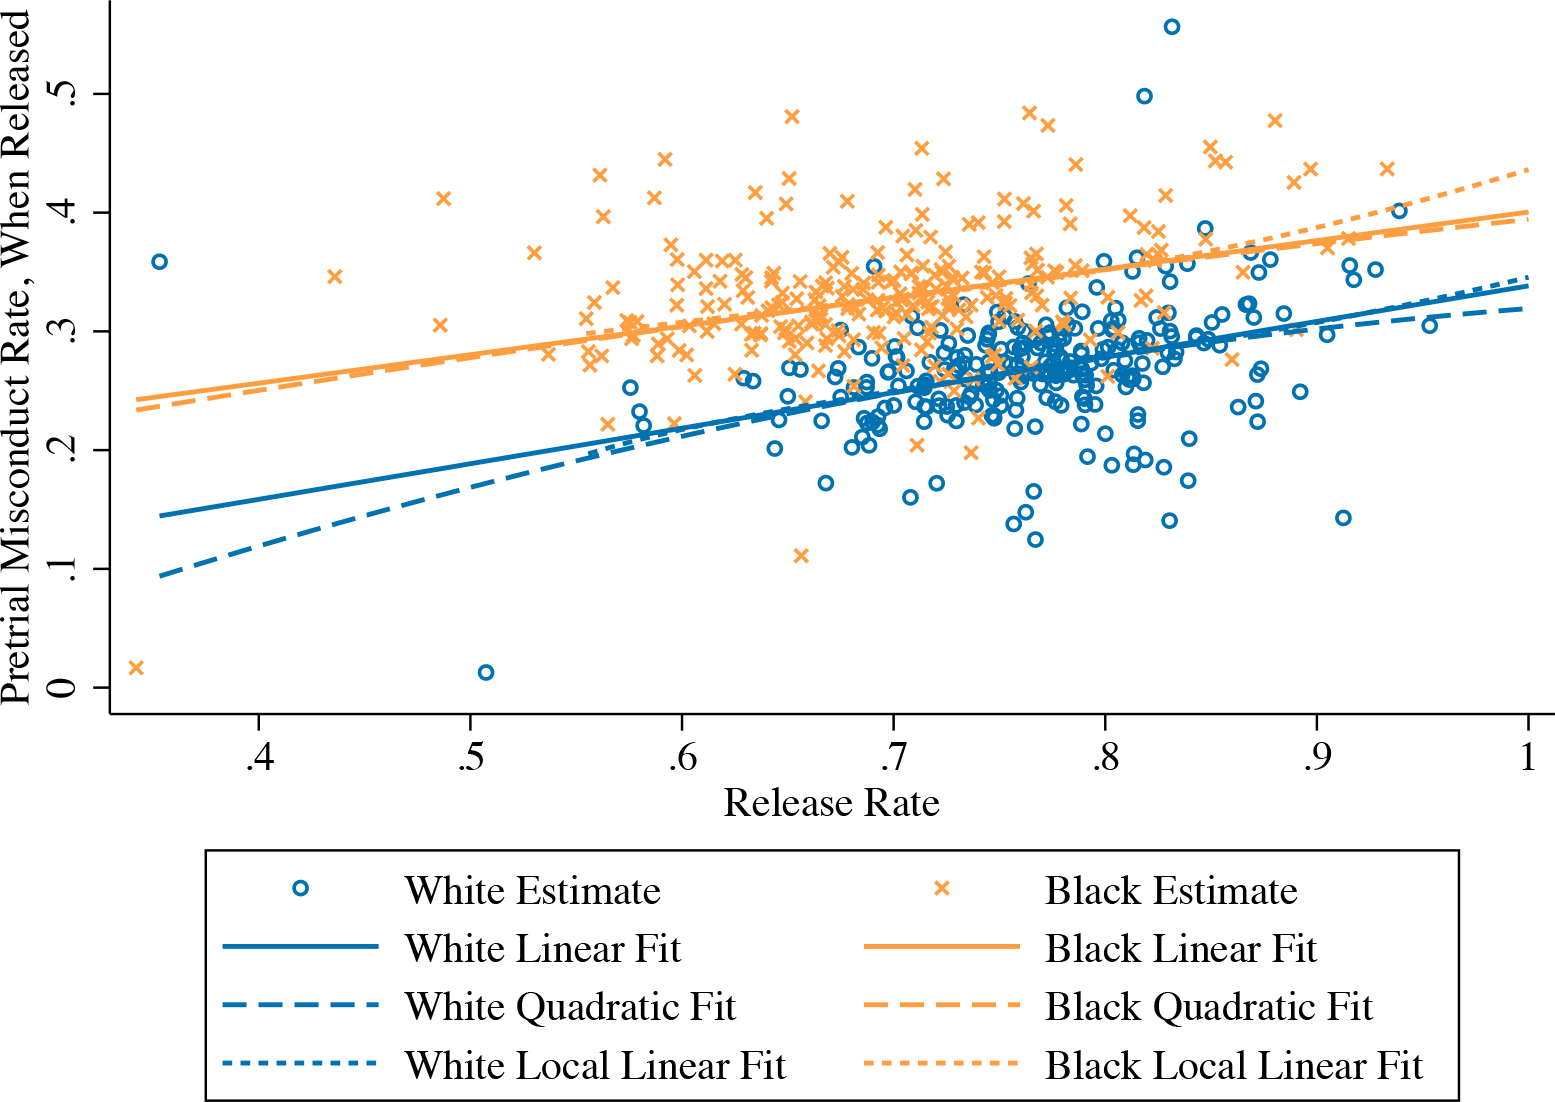
Figure 2:

Judge-Specific Release Rates and Conditional Misconduct Rates
Notes. This figure plots race-specific release rates for the 268 judges in our sample against rates of pretrial misconduct among the set of released defendants. All estimates adjust for court-by-time fixed effects. The figure also plots race-specific linear, quadratic, and local linear curves of best fit, obtained from judge-level regressions that inverse-weight by the variance of the estimated misconduct rate among released defendants. The local linear regressions use a Gaussian kernel with a race-specific rule-of-thumb bandwidth.
