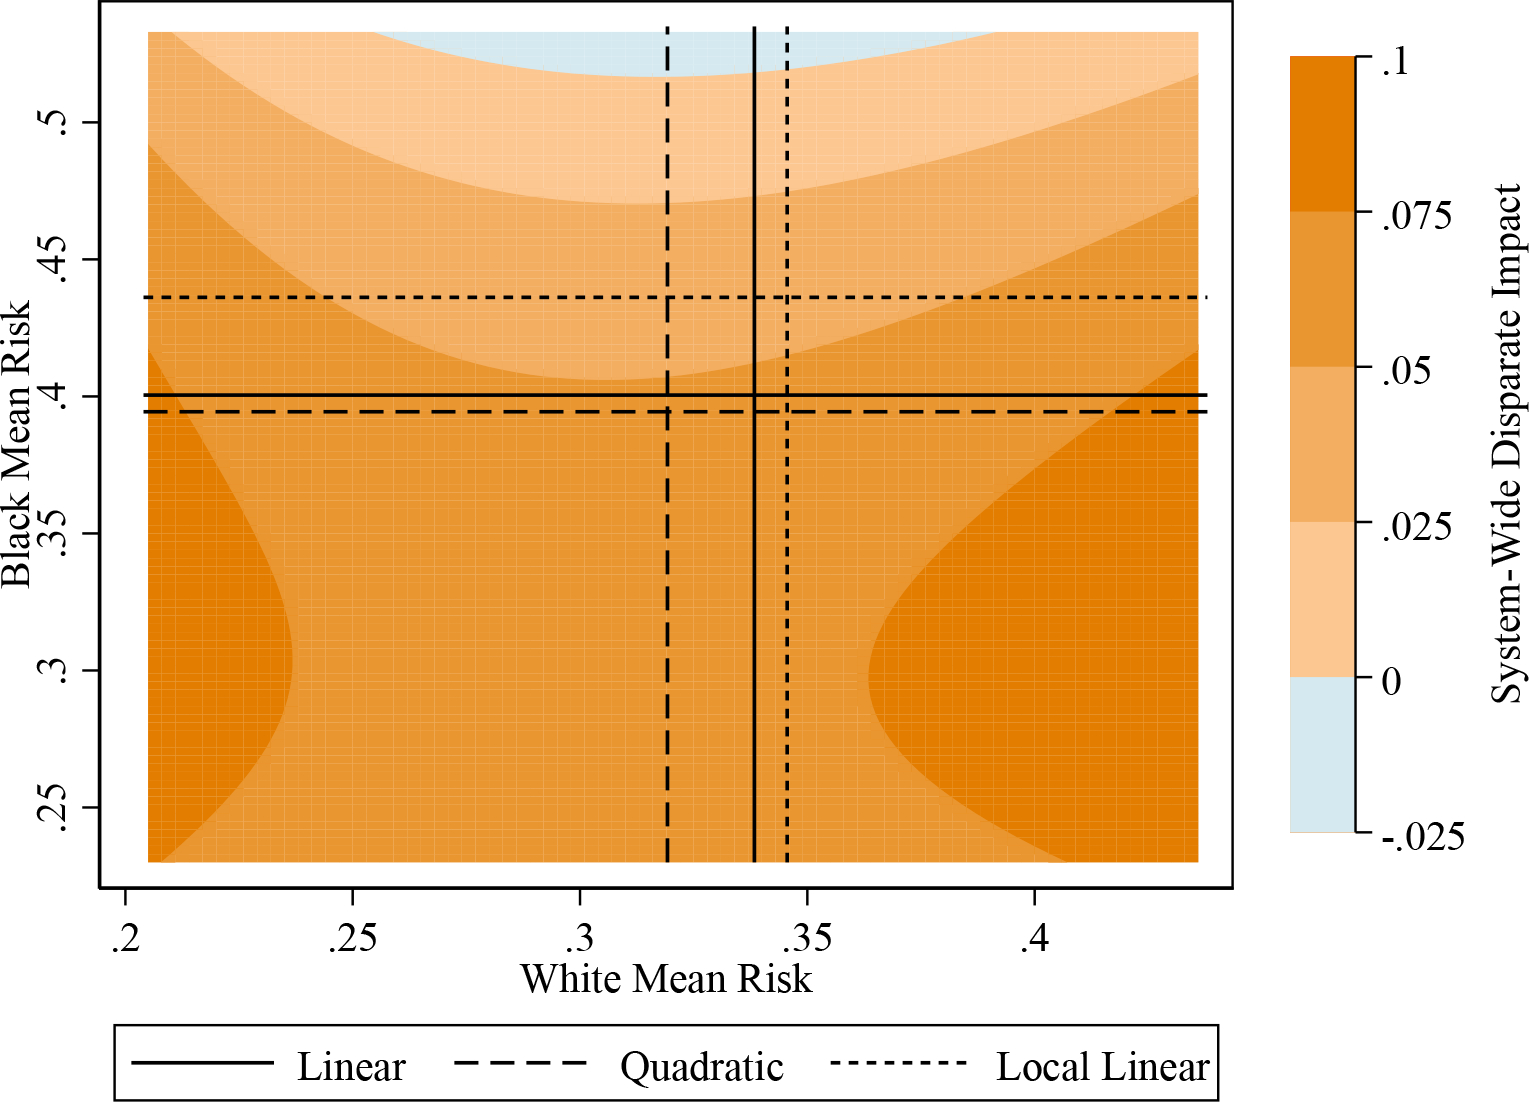
Figure 4:

Sensitivity Analysis
Notes. This figure shows how our estimate of system-wide disparate impact changes under different estimates of white and Black mean risk. The mean risk estimates obtained from the linear, quadratic, and local linear extrapolations in Figure 2 are indicated by solid, dashed, and dotted lines. The ranges of white and Black mean risk reflect the bounds implied by average misconduct and release rates.
