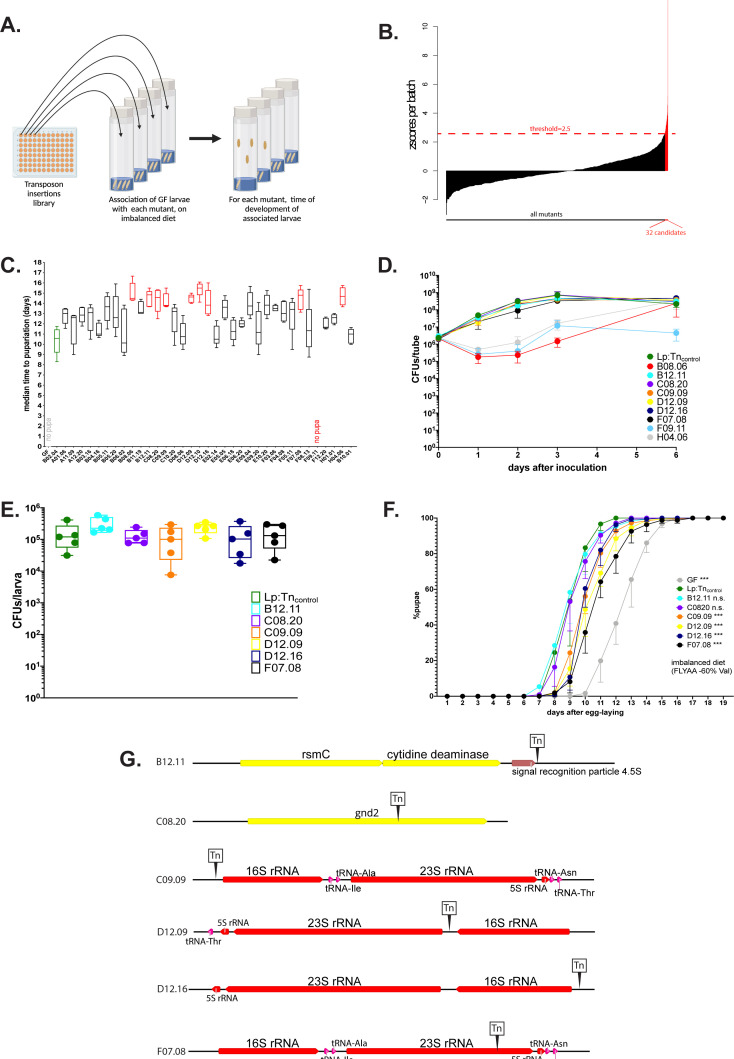
Figure 2. The operons encoding ribosomal and transfer RNAs (r/tRNAs) in L. plantarum (Lp) are necessary for Lp to rescue the delay due to amino acid (AA) imbalance.
(A) Representation of the genetic screen. (B) Result of the screen: for each Lp mutant (X-axis), we calculated the median time of development of associated larvae on a severely imbalanced diet (FLY AA –80% Val) and normalised it into a z-score (Y-axis). We selected the 32 candidates that yielded a z-score >2.5. (C) Developmental timing of germ-free (GF) larvae (grey) and larvae associated with Lp:Tncontrol (green) or the 32 candidate mutants from the genetic screen, on a severely imbalanced diet (FLY AA –80% Val). GF larvae and larvae associated with mutant F09.11 did not reach pupariation. Boxplots show maximum, minimum, and median of D50 (median time of pupariation) of five replicates per condition. Each replicate consists in one tube containing 40 larvae. We performed a Kruskal-Wallis test followed by post hoc Dunn’s tests to compare all mutants to Lp:Tncontrol. In red: statistically significant difference with Lp:Tncontrol (p-value <0.05). (D) Growth of the nine candidates on imbalanced diet (FLY AA –60% Val), in association with larvae. The graph shows the quantity of colony-forming units (CFUs) of Lp over time (mean and standard deviation of three replicates). (E) Colonisation of the larval gut by the six remaining candidates, on imbalanced diet (FLY AA –60% Val). The graph shows the quantity of CFUs of Lp per larva (mean and standard deviation of 5 replicates). We performed a Kruskal-Wallis test followed by post hoc Dunn’s tests to compare each candidate to Lp:Tncontrol and found no statistically significant difference. (F) Developmental timing of larvae raised on imbalanced diet (FLY AA –60% Val), in GF condition or in association with each one of the six candidates or with Lp:Tncontrol. The graph represents the total fraction of emerged pupae over time as a percentage of the final number of pupae. The graph shows five replicates per condition (mean and standard deviation). Each replicate consists in one tube containing 40 larvae. We used a Cox proportional hazards model to compare the effect of each candidate to the effect of Lp:Tncontrol. The p-values were adjusted by the Tukey method. n.s.: non-significant. ***: p-value <0.001. (G) Representation of the six transposon insertions. Tn: transposon. rspC: 16S rRNA methyltransferase. gnd2: phosphogluconate dehydrogenase. Of note, C09.09 and F07.08 show two independent insertions in the same r/tRNA operon.


