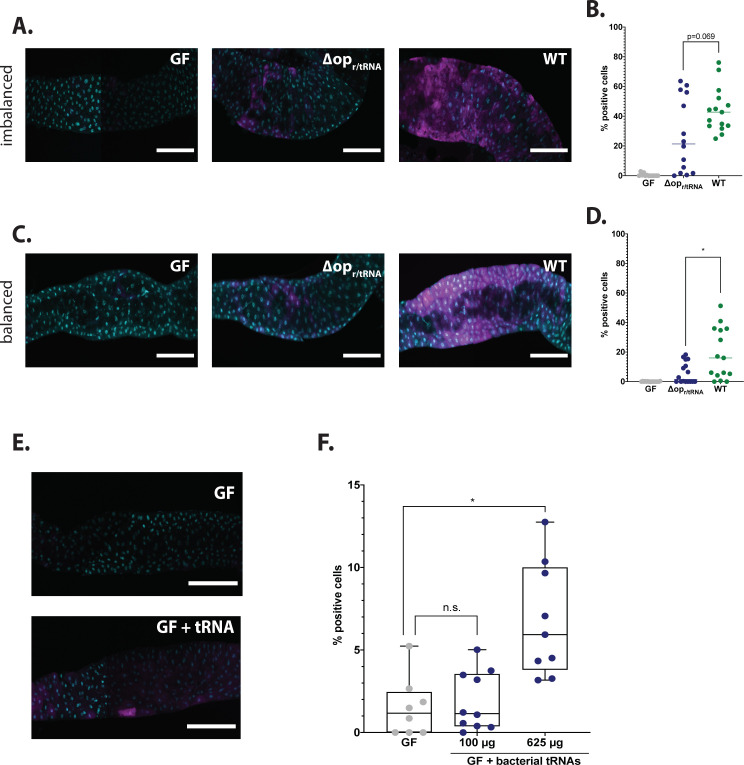
Figure 5. L. plantarum (Lp) mutants for ribosomal and transfer RNA (r/tRNA) operon fail to activate general control nonderepressible 2 (GCN2) in the anterior midgut.
(A,C) Representative pictures of the anterior midgut of 4E-BPintrondsRed larvae in germ-free (GF) conditions (left panels), in association with LpΔopr/tRNA (middle panels) or in association with Lp WT (right panels). Cyan: DAPI. Magenta: 4E-BPintrondsRed reporter. Scale bar: 200 µm. (B,D) Quantification of the signal: proportion of enterocytes positive for 4E-BPintrondsRed reporter’s activity in the anterior midgut of GF larvae (grey), larvae associated with LpΔopr/tRNA (blue) and larvae associated with Lp WT (green). Each dot represents one larva. The bar shows the mean. We performed Mann-Whitney test to compare association with Lp WT and association with LpΔopr/tRNA. *: p-value <0.05. (A) Larvae fed an imbalanced diet (FLY AA –60% Val), signal quantified in (B). (C) Larvae fed a balanced diet (FLY AA), signal quantified in (D). (E) Representative images of 4E-BPintrondsRed GF larvae (top panel) and 4E-BPintrondsRed GF larvae fed 625 µg of bacterial tRNAs (bottom panel) on balanced diet (FLY AA). Cyan: DAPI. Magenta: 4E-BPintrondsRed reporter. (F) Quantification of the signal: proportion of enterocytes positive for 4E-BPintrondsRed reporter’s activity in the anterior midgut of GF larvae (grey), GF larvae fed with increasing concentrations of bacterial tRNAs (blue) on balanced diet (FLY AA). Each dot represents one larva. We performed a Kruskal-Wallis test followed by post hoc Dunn’s tests to compare each condition to GF. n.s.: non-significant. *: p-value <0.05.


