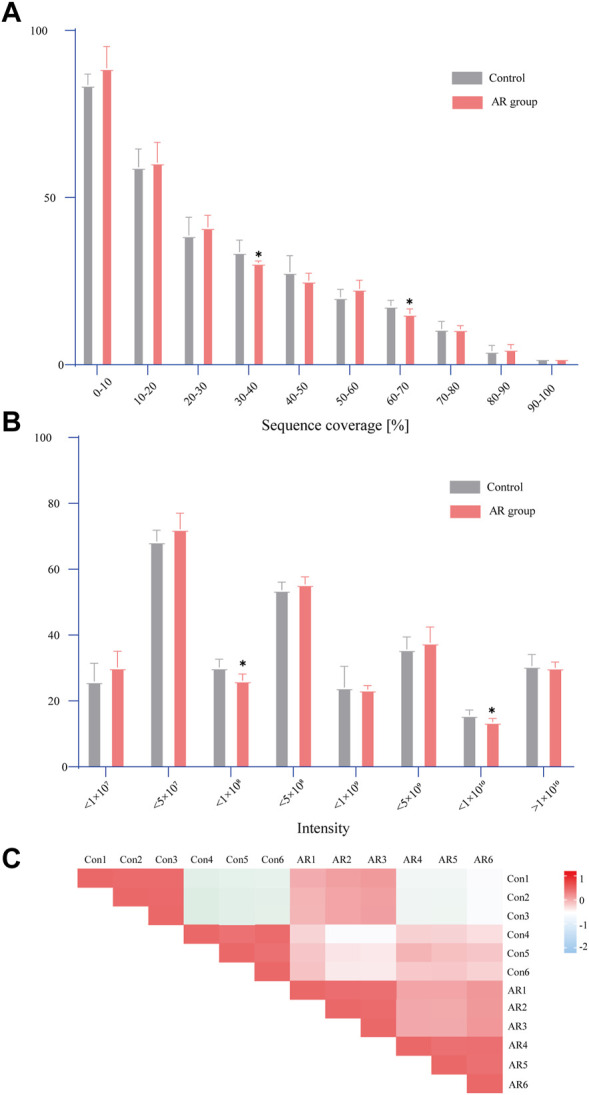
FIGURE 3.

Statistical analysis of proteome data. (A) Distribution of sequence coverage of proteome data on different samples. (B) Signal intensity distribution of proteome data on different samples. (C) Pearson correlation analysis (the comparison between the two groups was conducted using an independent sample t-test, n = 6 per group, *p < 0.05).
