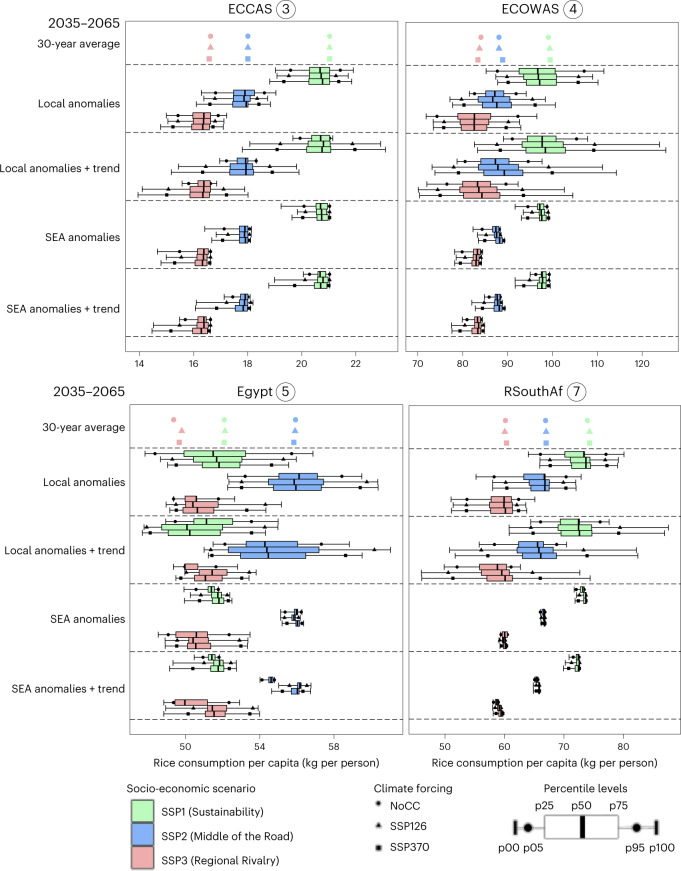
Fig. 4. Percentile levels of projected ensemble per capita rice consumption.
Results are shown in kg per person for the ECCAS, ECOWAS, Egypt and RSouthAf regions under different socio-economic and climatic narratives for the 2035–2065 time window (n = 30). The 30-year-average values indicate projected average per capita effects on rice consumption in the 2050s (see Fig. 1). Anomalies are calculated after linear detrending in the 2035–2065 time window. Total variation (anomalies + trend) is represented by projected values without detrending. See the Methods for the calculation of the distribution. Other regions can be found in Supplementary Fig. 8.

