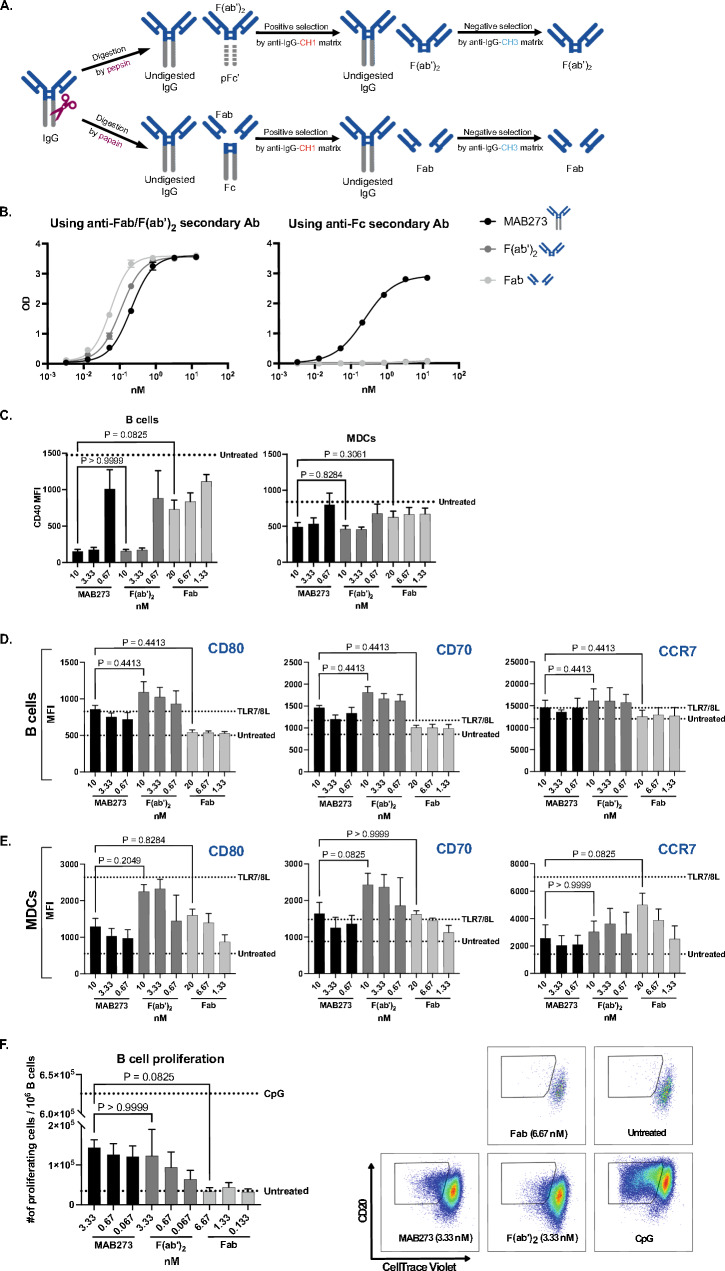
Fig. 2.
CD40 binding and activation retain the same after removing the Fc region of MAB273. n = 3, mean ± SEM. A Cartoon shows the process of generating Fab and F(ab’)2 fragments of MAB273. B ELISA results show the CD40 binding capacity of complete MAB273, its Fab or F(ab’)2 fragments, the readouts of OD values are displayed by using anti-Fab/F(ab’)2 (left) or anti-Fc (right) secondary antibodies, respectively. C Surface expression levels of CD40 on human PBMCs were evaluated by flow cytometry after exposure with complete MAB273, its F(ab’)2 or Fab fragments. The concentrations used were converted to nM for equal comparison. D–E. Human PBMCs were stimulated with complete MAB273, F(ab’)2, Fab or TLR7/8L (positive control). Costimulatory markers CD80, CD70 and LN homing marker CCR7 on B cells (D) and MDCs (E) were evaluated by flow cytometry. F Human PBMCs were stimulated with complete MAB273, F(ab’)2, Fab or CpG (positive control) for 5 days. B cell proliferation is displayed as the number of CellTrace Violet negative B cells per 106 B cells. Representative flow cytometry plots are shown

