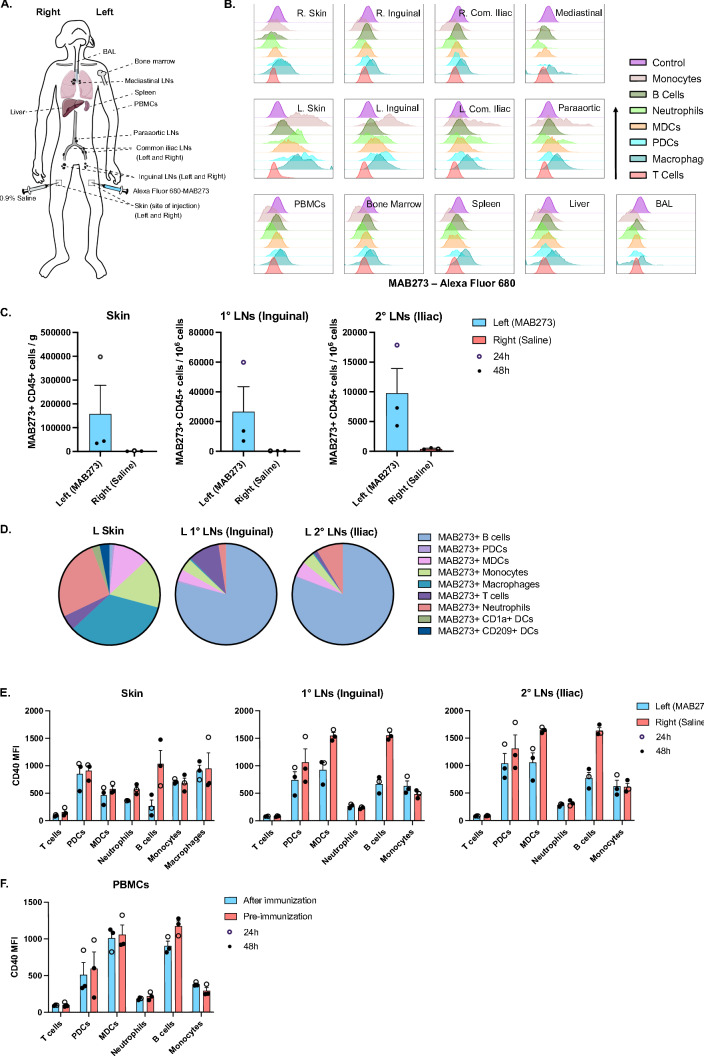
Fig. 5.
In vivo biodistribution of MAB273. A Rhesus macaques (n = 3) were administered 0.1 mg/kg s.c. of Alexa Fluor 680-MAB273 in the skin above the left quad and 0.9% saline solution s.c. in the skin above the right quad. The cartoon shows the sites of immunization and sampling performed after 24 h (n = 1) or 48 h (n = 2). B Histograms show Alexa Fluor 680-MAB273 signal on different cell populations in different tissues of one representative animal. Control = peripheral blood B cells from the same animal before immunization with labeled MAB273. C MAB273 + CD45 + cells normalized by counting beads at site of injection or draining LNs. n = 3, mean ± SEM. Compiled graphs show one animal that was sampled at 24 h (open circle), and two animals that were sampled at 48 h (closed circle). D Pie charts show proportion of different CD45 + immune cells targeted with MAB273 at the injection site, the primary and secondary draining LNs. The values are the average of three animals. E–F Expression of CD40 at site of injection and draining LNs (E) as well as PBMCs (F). Compiled data were evaluated by flow cytometry. Geometric mean fluorescence intensity (MFI) is shown. n = 3, mean ± SEM

