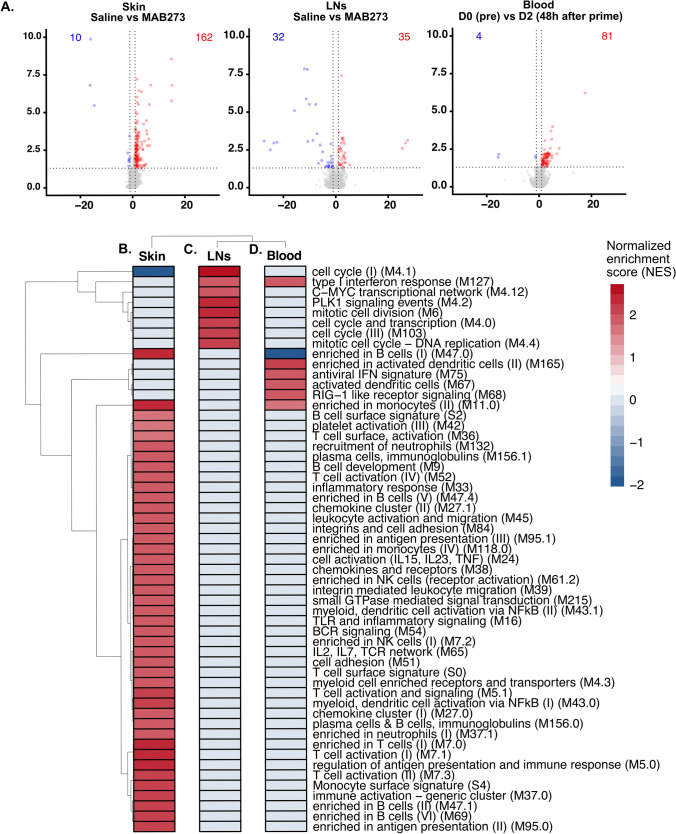
Fig. 6.
RNA-seq data analysis in different tissues. RNA-sequencing was performed on samples from rhesus macaques administered with AF680-MAB273 (see Fig. 5). n = 3. A Volcano plots of differentially expressed genes in skin, inguinal LNs and blood. Up-regulated genes are in red and down-regulated genes are in blue. The calculation of differentially expressed genes was based on a control reference for each tissue: D0 pre-immunization (blood) or saline site of injection (LNs and skin). Dotted grey lines indicate fold change > 1 and adjusted p values < 0.05. B–D Gene seat enrichment analysis (GSEA) of blood transcription modules significantly enriched in skin (B), LNs (C) and blood (D) compared to their respective control samples, color gradient is based on normalized gene set enrichment scores. All statistical comparisons were adjusted by the Benjamini–Hochberg procedure, adjusted p values < 0.05 were considered significant. “D0” is the day before prime immunization, “D2” is 48 h after prime

