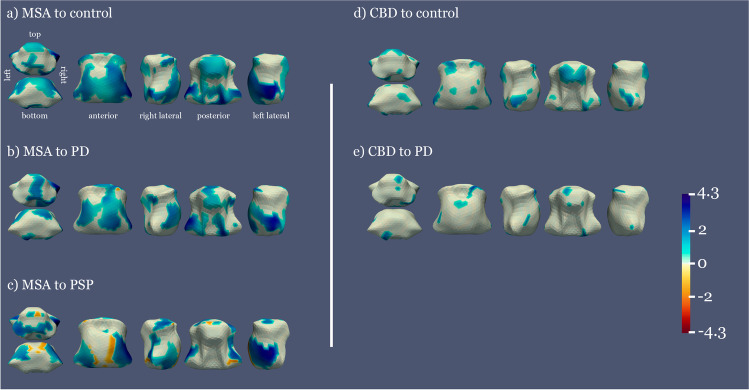
Fig. 1.
Mean distance between the average shape of each pair of groups, significant results. Color areas represent the distance between average shapes in the regions where significant differences between groups are observed (p < 0.05, FWE corrected). Warm to cold colormap showing areas in blue where the first group is significantly narrower than the second group and red for the opposite case. The vertical barcode represents the distance between groups in millimeters, 4.3 mm being the maximum distance found between the two groups

