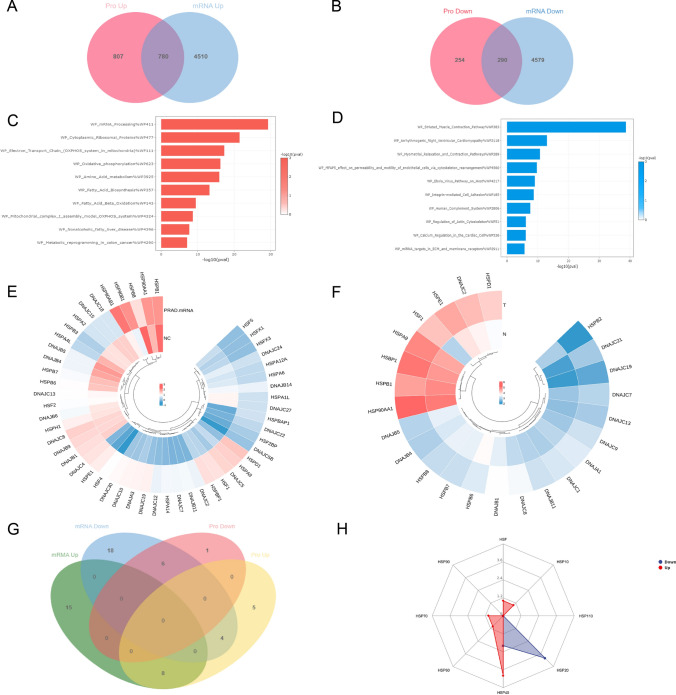
Fig. 1.
Proteomic analysis of high-risk prostate cancer. A, B Volcano map and heat map of differentially expressed protein. C, D Enrichment analysis of up-regulated and down-regulated protein WIKI pathways. E The heatmaps depicting the differential expression of Heat Shock Proteins (HSPs) at the mRNA level were obtained from the TCGA-PRAD database. F The heatmaps depicting the differential expression of Heat Shock Proteins (HSPs) at the protein level were obtained from our proteomic data. G The Venn graph shows intersection of differentially expressed HSPs in mRNA level and protein level. H Distribution of differentially expressed HSPs (According to molecular mass)

