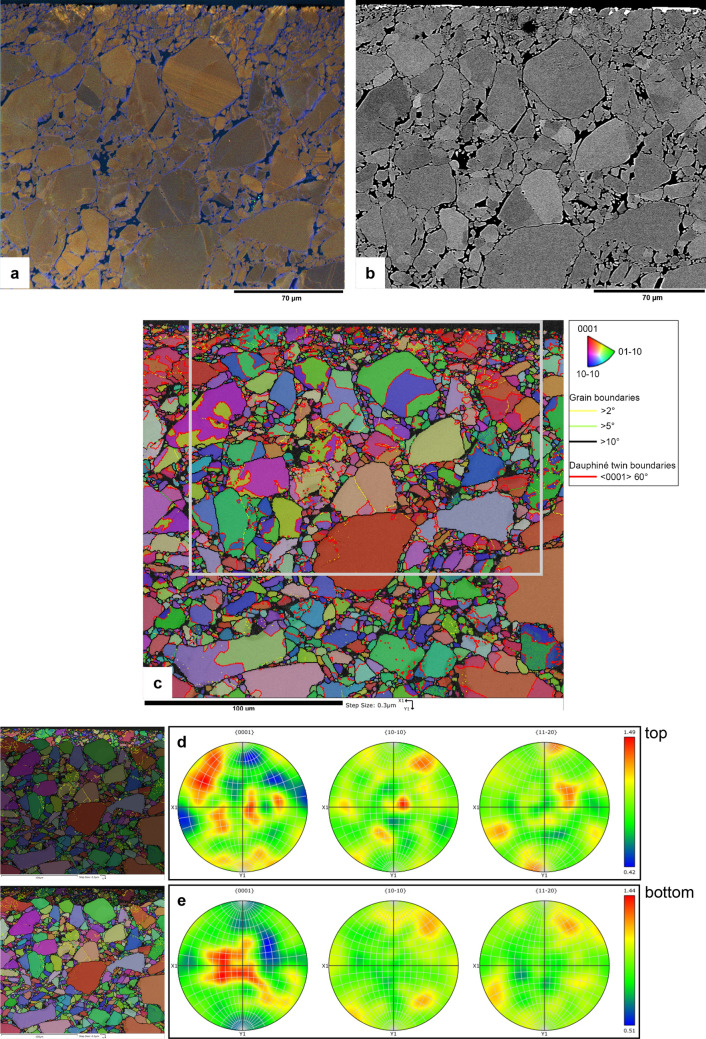
Figure 4.
(a) False-colour RGB SEM-CL image and (b) corresponding BSE image. Shear direction is in the image horizontal (probably top to the left). (c) EBSD IPF x map overlay on band contrast map, with grain boundaries (> 10° misorientation) in black, Dauphiné twin boundaries (60° rotation around the c-axis) in red, low-angle boundaries (5°–10°) in green and very low-angle boundaries (2°–5°) in yellow. Grey box shows the location of the CL and BSE images in (a) and (b). (d) Orientation density plot (equal area, lower hemisphere) for the top fine-grained part of the map in (c). (e) Orientation density plot (equal area, lower hemisphere) for the rest of the map in (c). Both top and bottom slow a low MUD (multiples of uniform distribution) of ~ 1.5, indicating no significant difference in crystal preferred orientation between the top (near the slip surface) and the rest of the sample. X1 and Y1 in the pole figures in d and e refer to X1 and Y1 axes of the EBSD map in (c), and are in the sample reference system.

