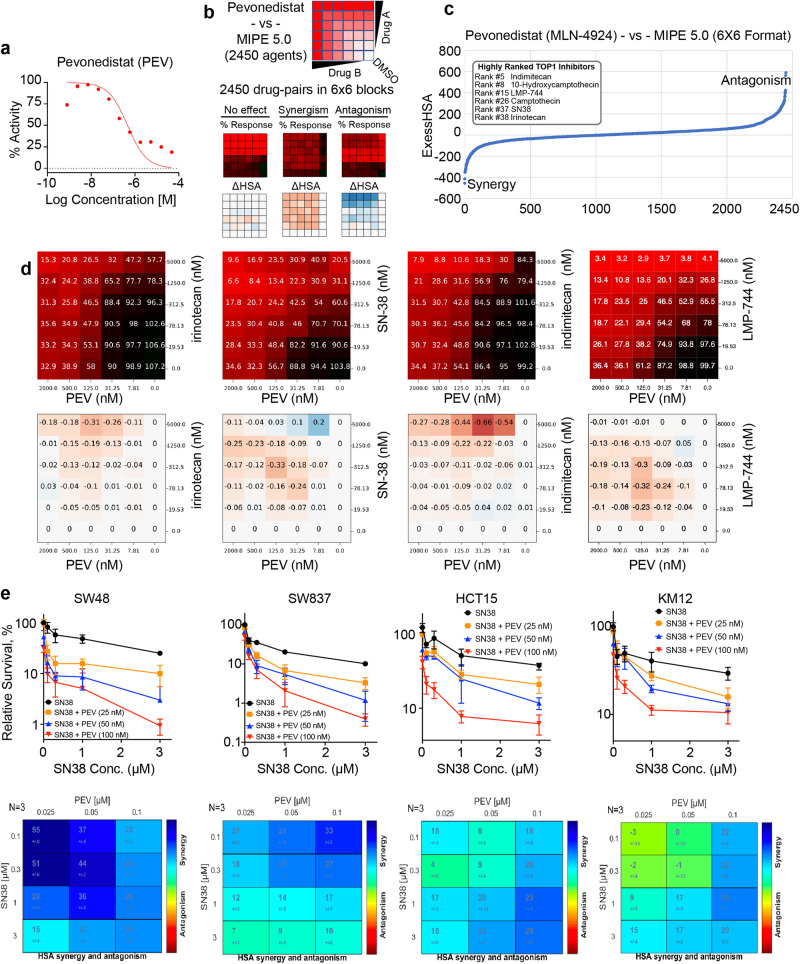
Fig. 1. High-throughput screening identifies pevonedistat (PEV) with TOP1 inhibitors as synergistic combination in CRC cells.
a Dose-response curve of PEV derived from MIPE 5.0 library screen in HCT116 CRC cells. b Scheme of 6 × 6 matrix screening to examine PEV in combination with the MIPE5.0 library in HCT116 cells. In response matric, red indicates strong response whereas black indicates poor response. In excess over the Highest Single Agent (ExcessHSA or ΔHSA) metric, orange indicates synergy whereas blue indicates resistance. c Drug-target enrichment analysis plots highlighting the synergy of PEV with TOP1 inhibitors. PEV-TOP1 inhibitor pairs ranked using the ExcessHSA metric. d Response (top panels) and ΔHSA (bottom panels) heatmaps for the combination of PEV with camptothecins irinotecan and SN38 (the bioactive metabolite of irinotecan) and indenoisoquinolines LMP776 (indimitecan) and LM744 across defined concentration ranges in HCT116 cells. e Top panels: viability curves for 72 h treatments with SN38 at defined concentrations in the indicated CRC cell lines (mean ± SD, N = 3 biologically independent experiments) using ATPlite Luminescence Assay. Cells were treated with PEV at defined concentrations 4 h before SN38. Bottom panels: SN38-PEV pairs ranked by ExcessHSA metric using Combenefit, an interactive platform for the analysis of drug combinations.

