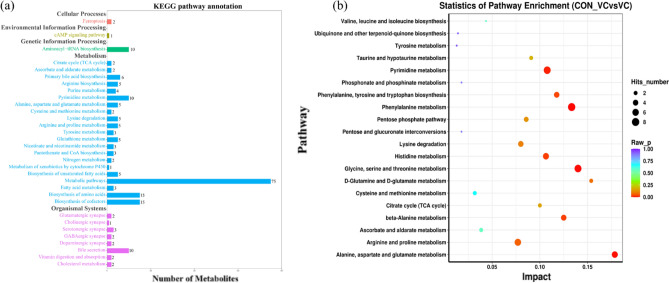
Figure 6.
KEGG pathway annotation and enrichment analysis of metabolites in yak serum after VC injection. (a) KEGG pathway annotation analysis of metabolic pathways. The horizontal axis is the number of differentially altered metabolites, and the vertical axis is the pathway. Different colors represent different secondary-level of pathway classification in the KEGG system. (b) Enrichment analysis of the top 20 metabolic pathways. The color and size of each circle is based on P-values and pathway impact values respectively.

