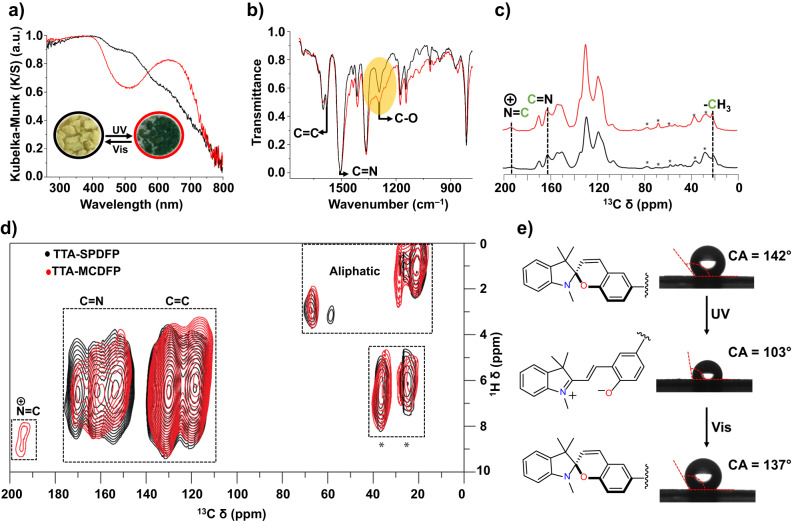
Fig. 3. Solid state photoswitching behavior of the TTA-SPDFP COF.
a Overlaid solid-state DR UV-vis spectra illustrating the light-induced spectral changes of the COF before (black trace) and after (red trace) exposure to 365 nm UV light irradiation, inset images of TTA-SPDFP COF showing the reversible color change upon UV- light irradiation. b Overlaid FT-IR spectra of the as-synthesized TTA-SPDFP COF (black trace) and the TTA-MCDFP COF (red trace) following UV light irradiation. The significant change in the C-Ospiro vibration band upon UV irradiation is shaded in yellow. c Overlaid one-dimensional 13C CPMAS NMR spectra depicting the spectral changes of TTA-SPDFP COF before (black) and after photoisomerization (red). d Overlay of the two-dimensional 1H-13C heteronuclear correlation (CPMAS NMR) spectra of TTA-MCDFP COF (red) and TTA-SPDFP COF (black). Both spectra were obtained using a MAS frequency of 14 kHz at 600 MHz (1H Larmor frequency). Spinning side bands are indicated by asterisks. e Changes in the surface contact angle of TTA-SPDFP COF before and after UV light irradiation for 5 min followed by visible-light (450 nm) irradiation for 8 h.

