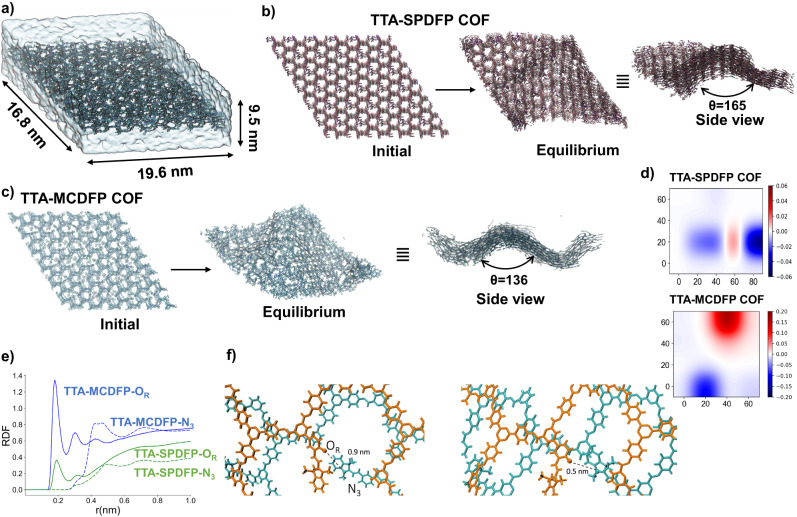
Fig. 6. Molecular dynamics simulation study of TTA-SPDFP and TTA-MCDFP in water and in vacuum.
a Simulation box of the molecular dynamics set up with TTA-MCDFP in water, b TTA-SPDFP in vacuum initial structure and its structure after equilibrium is reached (top and side views). c Same as B this time for TTA-MCDFP in water. d The structure of COFs is characterized by the average curvature plotted for the x-y plane. The color bars show the Gaussian curvature value for the two COFs, the larger the value the larger the curvature. e Radial distribution function of OR and N3 atoms of the COF with water. f The conformational change of TTA-MCDFP layers leading to curvature formation in water observed during simulations.

