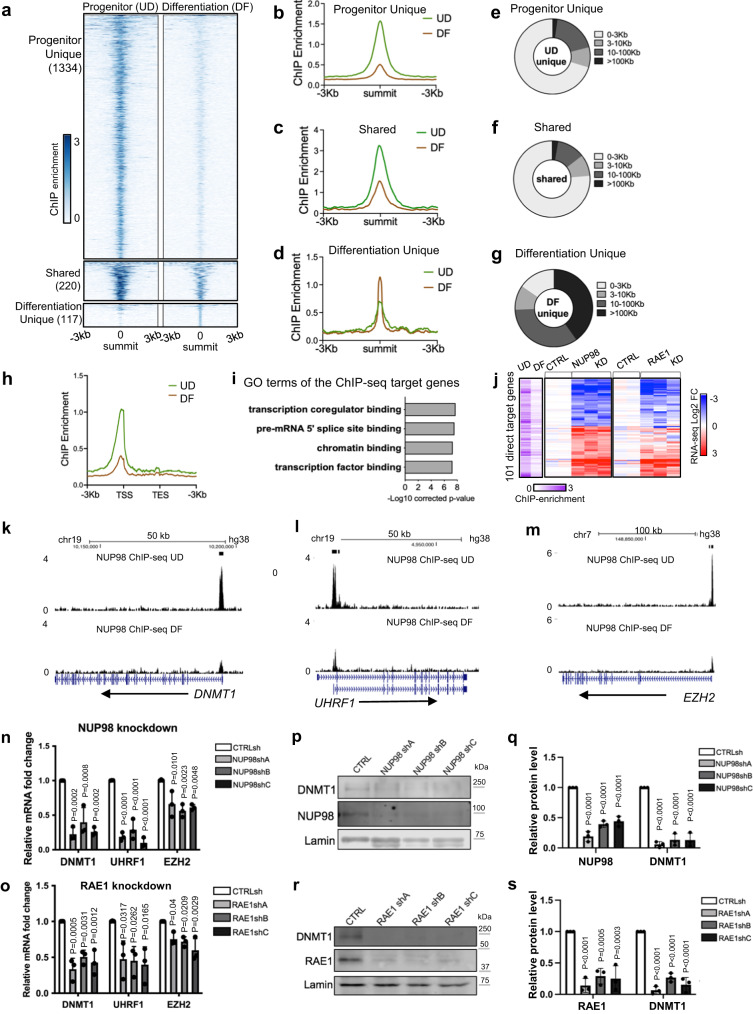
Fig. 3. NUP98 binds near the TSSs of key regulators in progenitor maintenance.
a–d Summit-centered heatmaps and average diagrams comparing NUP98 ChIP enrichment between the progenitor state (UD) and the differentiation state (DF). e–g Pie charts showing the distribution of the NUP98 ChIP-seq peaks, based on their distances to the nearest Transcriptional Start Sites (TSSs). h Average diagram comparing NUP98 ChIP-seq enrichment near the transcription start and end sites of the target genes. i Top Gene Ontology (GO) terms of the nearest genes associated with NUP98 ChIP-seq peaks. j Heatmap showing the 101 genes, featuring NUP98 ChIP-seq enrichment and are significantly changed with NUP98 knockdown. Relative NUP98 ChIP enrichment in UD and DF associated with these gene, and their relative expression with NUP98 or RAE1 knockdown, are included for each of these genes side by side. k–m Browser track examples of NUP98 ChIP-seq enrichment, comparing UD vs. DF. n, o qRT-PCR validation of representative target genes with NUP98 or RAE1 knockdown (one-way ANOVA with post-hoc test, N = 3 biological replicates, data are represented as mean ± standard deviation). p–s Western blot and quantification comparing DNMT1 protein levels with NUP98 or RAE1 knockdown, with Lamin used as the loading control (one-way ANOVA with post-hoc test, N = 3, quantification data are represented as mean ± standard deviation).

