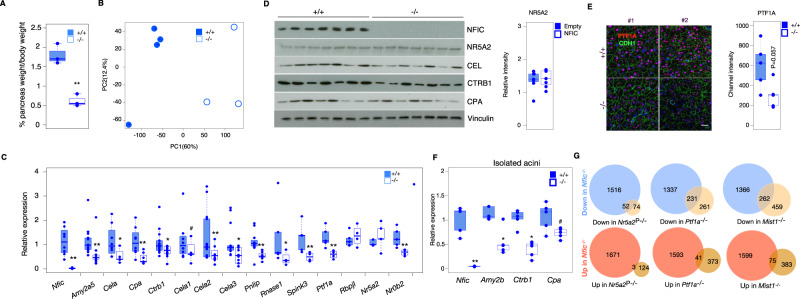
Fig. 2. NFIC is required for normal acinar cell differentiation.
A The pancreas of Nfic-/- mice has a reduced relative size (n = 3/group, two-tailed Student T-Test, P = 0.0013). B Principal component analysis of the RNA-Seq transcriptomes from WT and Nfic-/- mice. C RT-qPCR showing reduced expression of transcripts coding for digestive enzymes and pancreatic TF in Nfic-/- pancreata [n = 3/group; P < 0.1 (#), P < 0.05 (*), P < 0.01 (**), two-tailed Mann Whitney U-Test. Nfic, P = 0.0015; Amy2a5, P = 0.0006; Cela, P = 0.011; Cpa, P = 0.009; Ctrb1, P = 0.034; Cela1, P = 0.2187; Cela2, P = 0.024; Cela3, P = 0.028; Pnlip, P = 0.003; Rnase1, P = 0.25; Spink3, P = 0.035; Ptf1a, P = 0.015; Rbpjl, P = 0.73; Nr5a2, P = 0.015; Nr0b2, P = 0.035]. D Western blotting showing reduced expression of digestive enzymes, but not NR5A2 (P = 0.654), in Nfic-/- pancreata (n = 7/group). E IF analysis of the expression of PTF1A in pancreatic epithelial CDH1+ cells of Nfic WT and KO mice. (Scale bar = 10 μm). Fluorescence quantification shown in the accompanying bar graph (P = 0.03, two-tailed Student T-test). Densitometric quantification of panel 3B: band intensity normalized to loading control, relative to wild-type pancreata (n = 5/group). F RT-qPCR showing reduced expression of transcripts coding for digestive enzymes in primary acini from Nfic-/- mice [n = 5/group, P < 0.1 (#), P < 0.05 (*), P < 0.01 (**); two-tailed Mann–Whitney U-test. Nfic, P = 0.008; Amy2b, P = 0.015; Ctrb1, P = 0.007; Cpa, P = 0.095]. G Comparison of the overlap of DEG in the pancreas of Nfic-/- vs. that of mice lacking NR5A2, PTF1A, and MIST1 (details in text). Statistics: two-tailed Student T-test. Significant overlap is shown for downregulated genes compared to a random list of genes. “N-1” chi-squared test was used to calculate statistical significance. Barplots are presented as mean values +/− SD. Boxplots show the minimum, the maximum, the sample median, and the first and third quartiles. Source data are provided as a Source Data file.

