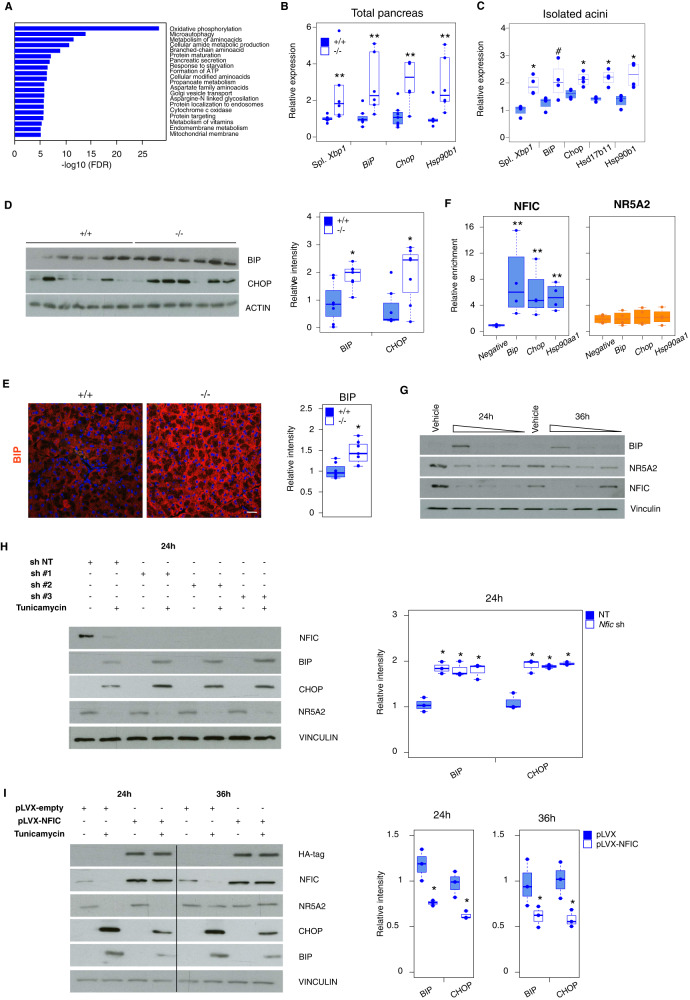
Fig. 5. NFIC regulates UPR and ER stress resolution.
A GSEA analysis of the UPR and ER stress gene sets down-regulated in Nfic-/- pancreata and up-regulation of UPR. B, C RT-qPCR analysis of ER stress-related transcripts in WT and Nfic-/- pancreata (n ≥ 6/group) (B) and in freshly isolated acini (n ≥ 3/group) (C). Two-tailed Mann–Whitney U-test was used to calculate statistical significance in B and C, except for BiP in C where two-tailed Student T-test was used (B Xbp1 spliced, P = 0.0038; BiP, P = 0.009; Chop, P = 0.008; Hsp90b1, P = 0.0101) (C Xbp1 spliced, P = 0.028; BiP, P = 0.005; Chop, P = 0.008; Hsd17b11, P = 0.028; Hsp90b, P = 0.01). D Western blotting showing up-regulation of BIP and CHOP in Nfic-/- pancreata (n = 7/group) (two-tailed Mann–Whitney U-test; BiP, P = 0.0175; CHOP, P = 0.047). Bar graph with densitometric quantification of data. E IF analysis of BIP in wild type and Nfic-/- pancreata (n ≥ 7/group). Boxplot shows quantification of the BIP expression intensity in WT and Nfic-/- pancreata. Individual dots correspond to the average of at least 15 images for each pancreas, scale bar = 10 μm. F ChIP-qPCR showing binding of NFIC, but not NR5A2, to the promoters of Hspa5/Bip-1, Ddit3 and Hsp90aa1 (n = 4) (two-tailed Mann–Whitney U-test; BiP, Chop and Hsp90aa1, P = 0.0286 in the NFIC ChIP). G 266-6 cells incubated for 24 h or 36 h with vehicle or increasing TM concentrations (10 nM, 1 nM, 0.1 nM). Data shows the up-regulation of BIP and the down-regulation of NFIC by 24/36 h and the down-regulation of NR5A2 by 24 h in TM-treated cells (one of three independent experiments is shown). H Up-regulation of BIP and CHOP in 266-6 cells treated with TM upon Nfic knockdown. Boxplot shows quantification of data (n = 3 replicates/group) [two-tailed Student T-test; BiP in Nfic sh#1, P = 0.002; in Nfic sh #2, P = 0.004; in Nfic sh #3, P = 0.005. Chop in Nfic sh #1, P = 0.0038; in Nfic sh #2, P = 0.002; in Nfic sh #3, P = 0.001]. I Reduced BIP and CHOP expression in control and NFIC-overexpressing 266-6 cells treated with TM [two-tailed Student T-test; 24 h: BiP, P = 0.01; CHOP, P = 0.02; 36 h: BiP, P = 0.04; CHOP, P = 0.03]. Boxplots show quantification of data (n = 3 replicates/group). P < 0.1 (#), P < 0.05 (*), P < 0.01 (**); two-tailed Mann–Whitney U-test to calculate the significance in all panels. Boxplots show the minimum, the maximum, the sample median, and the first and third quartiles. Source data are provided as a Source Data file.

