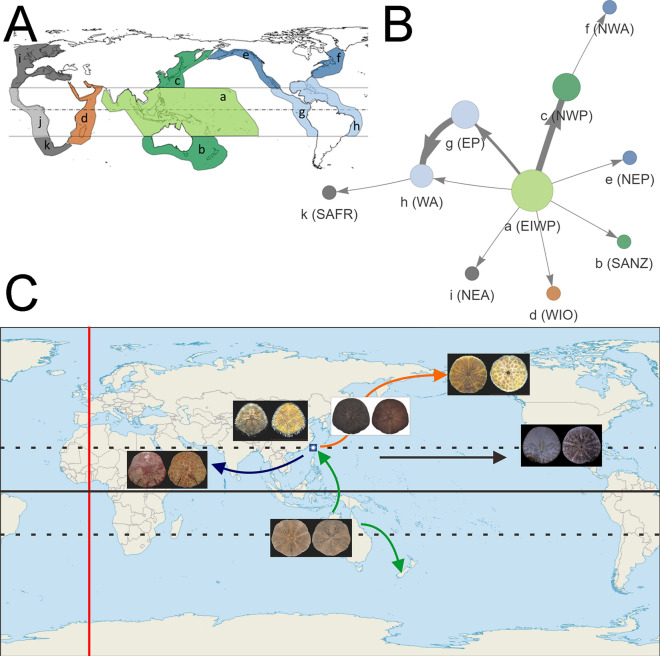
Figure 4.
Biogeography and migration network of Taiwanese fauna. (A) 11 defined biogeographical regions for Luminacea modified from previous studies15,18. a. Tropical eastern Indian Ocean and western Pacific Ocean (EIWP); b. Southern Australia and New Zealand (SANZ); c. Northwestern Pacific (NWP); d. Tropical western Indian Ocean (WIO); e. Northeastern Pacific (NEP); f. Northwestern Atlantic (NWA); g. Tropical eastern Pacific (EP); h. Tropical western Atlantic and Caribbean Sea (WA); i. Northeastern Atlantic and Mediterranean (NEA); j. Tropical East Atlantic (EA); k. South Africa (SAFR). Figure was made with Microsoft PowerPoint (https://www.microsoft.com/, version 2016). (B) StrainHub39 biogeographic network. Connections between geographic provinces is indicated by edges. Arrows indicate direction of migration and thickness of nodes indicates frequency. We used the RASP tree (Fig. S1) and geographic metadata to create the network and calculate the source/hub ratio (SHR). The SHR indicates the relative importance of geographic provinces as sources. Larger circles are more important sources of lineages. Figure was generated with StrainHub v0.2.3 on R v4.1.2. (https://doi.org/10.1093/bioinformatics/btz646). (C) Hypothesized migration trends for key sand dollar species reported in Taiwan waters. Map was created with QGIS (https://qgis.org/, version 3.0.3).

